|
 |
 |
 |
 |
 |
 |
 |
 |
 |
 |
| |
|
Running Total From 2010 |
|
|
|
|
|
|
|
$9061.00 |
|
Jan 19 11 |
28.55 |
BTC 8 put options Jan 29 @ .57 |
|
|
17.00 |
|
|
(473.00) |
(2.04) |
8588.00 |
|
Jan 19 11 |
28.35 |
STO 6 put options Jul 27 @ .95
COMMENTS See the rolldown below |
|
|
14.50 |
|
16214.50 |
555.50 |
5.1 |
9143.50 |
Jan
19 2011:
THE ROLL DOWN
The Oscillator has been flashing overbought
for a while now. Today with the stock at 28.55 I
bought back my 8 Jan 29 puts and rolled 6 out to
July at 27.00.What an exceptional trade this way.
This frees up another 5800.00 of capital for writing
more put options at lower strikes and reduces the
number of puts I have at this higher strike level.
Originally this was 10 contracts and through several
rolls I have reduced my exposure and my strike level
all the while still getting a credit on each
subsequent roll. It is important to stay focused and
remain with a strategy that has worked and not step
away from that strategy. In this case I spotted the
opportunity to roll a couple of days early and to
roll less contracts and move lower. It is the
consistency with having the plan always in focus and
taking advantage of opportunities as they present
themselves, that makes the strategy successful.
Rolling naked puts in this manner has worked for me
for many years.
 |
|
Jan 21 11 |
28.02 |
Expiry: 3 Naked Puts Jan 26 expired |
|
|
|
|
|
|
|
|
|
Jan
21 2011:
Expiry: My Jan 26 put options expired. This
leaves me with 6 July $27 put options and 8 Feb 25
put options. I have a lot of freed up capital to put
back into puts, but looking at the technicals
Microsoft looks like there could be a little bit of
a bounce and then selling should come into this
stock. The real warning is from MACD which since Jan
10 has been negative and despite the stock hanging
in at these levels, it is widening indicating that
selling is picking up in Microsoft. I will wait a
bit before selling more put options.
 |
|
Jan 28 11 |
27.55 |
STO 3 Naked Puts Mar 25 @ .38 |
|
|
10.75 |
|
7510.75 |
103.25 |
1.37 |
9246.75 |
|
Jan
28 2011:
It took a few days longer than I thought but
today there was good selling and I sold just a few
puts into March at 25.00. Why 25.00? Because I think
that is where Microsoft is heading over the next
month or so. There is good support at 25.00. I am
already holding Feb 25 naked puts so I see no reason
to load up on more. I can take my time and do a few
here and there to take advantage of big down days.
 |
|
Feb 18 11 |
27.06 |
Expiry: 8 put options Feb 25 expired |
|
|
|
|
|
|
|
|
|
Feb
18 2011:
EXPIRY: Today my 8 naked puts for Feb 25
expired. This now leaves me with 3 March 25 naked
puts and 6 July 27 naked puts. I will be placing
lots more as we move lower. I still believe the $25
strike is the point we are heading toward.
 |
|
Mar 1 11 |
26.25 |
STO 5 put options Apr 25 @ .58 |
|
|
13.25 |
|
12513.25 |
276.75 |
2.21 |
9523.50 |
|
Mar 1
2011: Microsoft is moving getting closer to the $25 level.
Today I sold another 5 put options for April 25. I am
just doing 5 as I think we will hit 25.00 and I want
to get the best premium I can as we come falling
down. Meanwhile though we are heading into oversold
territory and while Momentum looks like it is
picking up, MACD is actually showing buyers starting
to arrive. I believe there will be more buying as we
fall into that $25 range. If I am wrong and we keep
falling, then I am going to end up holding a lot of
25 put options. (ha ha).
 |
|
Mar 16 11 |
24.70 |
STO 10 put options April 25 @ 1.23 |
|
|
19.50 |
|
25019.50 |
1210.50 |
4.84 |
10734.00 |
|
Mar
16 2011:
Microsoft has reached $25.00 and closed below it. I
sold more puts today.
 |
|
Mar 18 11 |
25.10 |
Expiry: BTC 3 put options March 25 @ .22 |
|
|
10.75 |
|
|
(76.75) |
(1.02) |
10657.25 |
|
Mar 18 11 |
24.80 |
Expiry: Stock closed at 24.80
STO 5 put options April $24 @ .33
Comments: At today's close, I bought to close 3 Mar
25 naked puts and sold 5 for April at 24. |
|
|
13.25 |
|
12013.25 |
151.75 |
1.26 |
10993.25 |
|
Mar 21 11 |
25.25 |
STO 3 Naked Puts 18Jun11 $24 @ .74 |
|
|
10.75 |
|
7210.75 |
211.25 |
3.14 |
11204.50 |
|
Mar 21 11 |
25.25 |
STO 3 Naked Puts 16Jul11 $23 @ .59 |
|
|
10.75 |
|
6910.75 |
166.25 |
2.41 |
11370.75 |
|
Mar 21 11 |
25.25 |
STO 3 Naked Puts 22Oct11 $21 @ .60 |
|
|
10.75 |
|
6310.75 |
169.25 |
2.68 |
11540.00 |
|
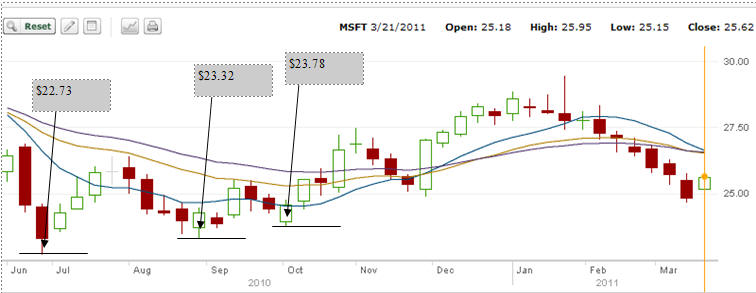
Mar
21 2011:
BACK TO REVERSE NAKED PUTS LADDER:
With
the recent pullback of Microsoft I have spread 9
naked puts out over 3 different durations from June
to October. Each set of 3 naked puts is at a lower
strike. This is my return to reverse ladder naked
puts. Microsoft has continued to perform well and
stayed right within an acceptable trading range. I
could continue to sell put options at the money month
after month but it makes a lot of sense to now
spread out the risk at lower strikes and reap the
income. As my at the money naked put for April will
probably expire out of the money, when those put
options expire I will then take some of that capital
and sell lower strikes further out and keep the
ladder rolling month after month. Basically when the
nearest month expires, it is then rolled out 3
months or so and at lower strikes. In this manner I
will probably keep around 50,000 tied to Microsoft
in lots of 3 contracts each and basically stay far
out of the money. As the puts lose their value I
will keep closing them early whenever profitable and
sell those 3 contracts further out in time. In this
way as Microsoft meanders around, I should be able
to stay consistently out of the money.
Deciding on the strikes to sell is simple. Looking
at the past year on Microsoft, the low was $22.73
and from there the stock made successively higher
lows. My goal will be to stay around those levels
and then have 3 contracts that I continue to sell as
close to the money, monthly whenever the chart tells
me trading that close to at the money has a good
chance of not being assigned. Meanwhile I will
continue to roll down the remaining 6 July $27 naked
put contracts until they are at the money and then I
will roll them forward and their capital will become
that capital I use for AT THE MONEY trades.
Effectively then the capital in play will be reduced
over the course of the year and the put contracts
will be spread out over a wide variety of strikes. I
have successfully used this strategy many times in
the past including on Microsoft. With the stock now
back into the mid $20 range, the reverse naked put
ladder strategy should work well.
Microsoft
has a lot going for it and it continues to generate
significant cash earnings through everything from
Windows7, Office 2010 to its Kinect products and
cloud computing, let alone the increasing share of
search powered by Bing. Microsoft will be around for
a long time but hopefully the stock will just keep
trudging along which is perfect for the reverse
naked ladder strategy.
|
|
|
|
|
|
|
|
|
|
|
|
|
|
April 9 2011:
MICROSOFT - THE ULTIMATE UTILITY STOCK
More
than a decade ago Microsoft was a tech stock, but
over the last 10 years, truly it is more a UTILITY
stock than a tech stock.
Read this report on the past 8 years of selling
Microsoft stock options
MICROSOFT
IS BETTER THAN GOLD:
In April
2003 gold was trading at around $325 US an ounce.
Today (April 6) it is around 1455.00 - This is a
347% return. If I had invested $10,000 in gold at
$325.00 US an ounce and cashed out today I would
have a total of $44,028.30 which includes the return
of my initial $10,000.00. Annualized this is a 20%
gain.
However through
selling Microsoft put options I have generated 33%
annualized and a total return of 925%.
Read the article.
|
|
Apr 15
11 |
25.38 |
Expiry: 15 Naked Puts April 25 expired
5 Naked Puts
April 24 expired |
|
|
|
|
|
|
|
|
|
Apr
15 2011:
Microsoft is back under pressure again. Yet looking
at the one year chart 24.00 looks like a great
strike. I already have a rever naked put ladder in
play, so I am basically just adding to my gains by
selling another 5 put options for May at $24.
Meanwhile I had 20 put options expire in April
freeing up $49500.00 for additional put options. By
selling the 5 May 24 I have used jusy 12,000 of that
capital. This gives me lots more room for upcoming
weeks should the opportunities arise.
|
|
Apr 15 11 |
25.20 |
Sold 5 put options May 24 @ .30 |
|
|
13.25 |
|
12013.25 |
136.75 |
1.13 |
11676.75 |
|
Apr 19 11 |
24.94 |
Sold 15 put
options May 24 @ .39
COMMENTS:
Just a
few days ago I wrote how Microsoft was better than
Gold for investment returns. Obviously few analysts
agree with me because today it's down again. Well I
love this stock and with so much free capital I
jumped in and sold another 15 put options. I have
been in and out of Microsoft over the past few years
but just about every month I have some put options
either being rolled or expiring. What a great stock
it has been. Thank you Microsoft for making my
returns so great. Keep doing what you are best at -
simply going nowhere! |
|
|
25.75 |
|
36,025.75 |
559.25 |
1.55 |
12,236.00 |
|
Apr 19 11 |
24.94 |
STO 10 put options 21May 25 @ .61 |
|
|
19.50 |
|
25013.25 |
590.50 |
2.36 |
12826.50 |
|
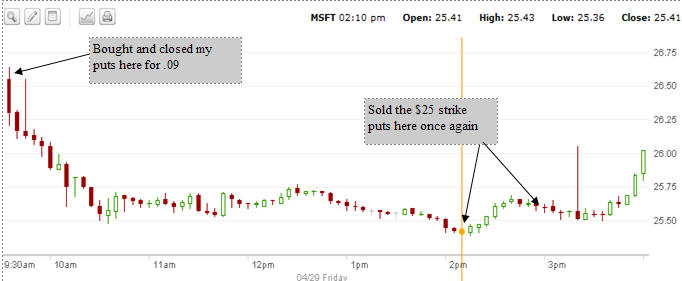
Apr
29 2011:
WOW is about all I can say. Third Quarter Earnings
came out after hours yesterday and today the stock
fell more than 4% at one point. What a great day to
be in Microsoft stock for those of us who sell
options. In the morning I bought and closed my May
$25 and $24 strike puts and in the afternoon I was
back selling them again. Double dipping (selling
options in the same month) is so very good for my
portfolio. The
market over reacted a bit on the Microsoft earnings.
The earnings were very good but the very notion that
Microsoft's core flagship product, Windows could be
seeing a slowing of sales worldwide, shook investor
confidence.
My
thoughts and opinions on the direction of Microsoft
are here.
My Microsoft stock
options have been a terrific strategy since the day
I started. Double digit returns every year and I
still see Microsoft as a very strong stock for my
put selling strategy. The
Microsoft Stock History charts I uploaded
show me that the trend for selling put options should
continue. Those investors who are buying the stock
and plan to "buy and hold" might want to reconsider
Microsoft stock. My charts do not show any real
value for buy and hold on Microsoft. I believe my
Microsoft Stock Price History
charts do NOT indicate any value holding the stock
over the long term. Ten years ago the stock was
trading basically where it is today. |
|
Apr 29 11 |
26.28 |
BTC 10 put options 21May $25 @ .09 |
|
|
19.50 |
|
|
(109.50) |
(0.43) |
12717.00 |
|
Apr 29 11 |
26.28 |
BTC 20 put options 21May $24 @ .03 |
|
|
32.00 |
|
|
(92.00) |
(0.19) |
12625.00 |
|
Apr 29 11 |
25.38 |
STO 10 put options 21May $25 @ .32 |
|
|
19.50 |
|
25019.50 |
300.50 |
1.20 |
12925.50 |
|
Apr 29 11 |
25.59 |
STO 10 put options 21May $25 @ .27 |
|
|
19.50 |
|
25019.50 |
250.50 |
1.0 |
13176.00 |
|
May 20 11 |
24.80 |
BTC 20 put options 21May $25 @ .23 |
|
|
32.00 |
|
|
(492.00) |
(0.94) |
12,684.00 |
|
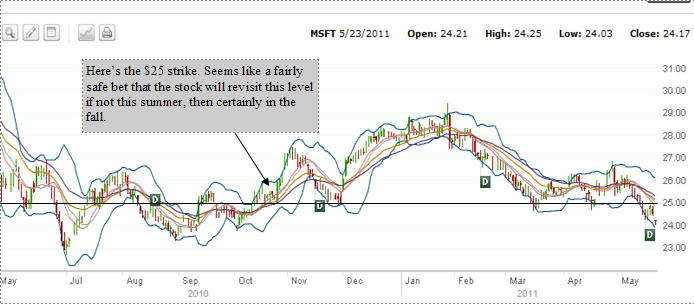
MAY 23 2011The
news that Microsoft bought SKYPE is depressing the
stock. It's the same old issue for investors - fear of the
unknown. The stock is having a lot of trouble, but
on Friday I closed my May 25 puts early in the day
and then today sold the same strike. I think $25.00
is good value in Microsoft and looking at the past
year, Microsoft has revisited this level many times.
I believe if the stock doesn't recover during the
summer it will in the fall. I don't plan on putting
any more capital into Microsoft, but instead I will
roll the puts forward if they end up in the money.
If I was very worried
about Microsoft I would not be selling puts but
would be waiting to see if the stock falls further
or can hold and gradually move back up. If I wanted
to sell puts but was not too worried I probably
would be selling at the 23 strike. I have a reverse
naked put ladder on Microsoft right now which you
can read about here.. .
 |
|
May 23 11 |
24.10 |
STO 10 put options 18JUN $25 @ 1.05 |
|
|
19.50 |
|
25019.50 |
1030.50 |
4.1 |
13,714.50 |
|
JUNE 17 2011I did quite a
number of trades with Microsoft today. To explain
them fully,
you can read this article which explains the
continued reverse naked put ladder.. |
|
Jun 17 11 |
24.25 |
Buy To Close 10 put options 18JUN11 $25 @ .79 |
|
|
19.50 |
|
|
(809.50) |
(3.2) |
12,905.00 |
|
Jun 17 11 |
24.25 |
Buy To Close 6 put options16JUL11 $27 @ 2.83 |
|
|
14.50 |
|
|
(1712.50) |
(10.56) |
11,192.50 |
|
Jun 17 11 |
24.13 |
Sold 6 naked puts 21JAN12 $26 @ 3.00 |
|
|
14.50 |
|
15614.50 |
1785.50 |
11.43 |
12,978.00 |
|
Jun 17 11 |
24.13 |
Buy To Close 3 Naked Puts 17JUN11 $24 @ .02 |
|
|
10.75 |
|
|
(16.75) |
(0.10) |
12,961.25 |
|
Jun 17 11 |
24.13 |
Sell To Open 3 Naked Puts 20AUG11 $23 @ .58 |
|
|
10.75 |
|
6910.75 |
163.25 |
2.3 |
13,124.50 |
|
Jun 17 11 |
24.13 |
Sell To Open 3 Naked Puts 20AUG11 $22 @ .36 |
|
|
10.75 |
|
6610.75 |
97.25 |
1.4 |
13,221.75 |
|
Jul 5 11 |
25.99 |
Sell to Open 10 Naked Puts 20Aug11 $24 @ .25 |
|
|
19.50 |
|
24019.50 |
230.50 |
0.95 |
13,452.25 |
|
Jul 5 11 |
25.99 |
Sell To Open 5 Naked Puts 17SEP11 $24 @ .47 |
|
|
13.25 |
|
11,986.75 |
221.75 |
1.8 |
13,674.00 |
|
JUL
5 2011: Today I entered into a stock purchase as
well as put selling on Microsoft stock. On July 7 I
sold the stock for a 3.1% gain.
In this
article I explain the importance of a plan, goal and
objective PRIOR to commencing the trade, in
attaining success when it comes to trading. This
trading anatomy can be used on any stock trade. I
hope you enjoy the article. |
|
Jul 5 11 |
25.99 |
Bought 1000 shares at $25.99 |
|
|
7.00 |
|
25,997.00 |
|
|
|
|
Jul 7 11 |
26.81 |
Sold 1000 shares at $26.81 |
|
|
7.00 |
|
26,803.00 |
806.00 |
3.1 |
14,480.00 |
|
Jul 11 11 |
26.66 |
Bought to close 3 Naked Puts Aug 22 @ .05 |
|
|
10.75 |
|
|
(25.75) |
(0.38) |
14,454.25 |
|
Jul 11 11 |
26.66 |
Bought to close 3 Naked Puts July 23 @ .01 |
|
|
10.75 |
|
|
(13.75) |
|
14,440.50 |
|
JUL
12 2011:
To understand this new In The Money Covered Call
Trade, read this article. |
|
Jul 12 11 |
26.42 |
Bought 2000 shares at $26.42
COMMENTS: I
bought these shares for a new in the money covered
call trade |
|
|
7.00 |
|
(52,840.00) |
|
|
|
|
Jul 13 11 |
26.89 |
Sold 10 Covered Calls August 25 @ 2.12 |
|
|
19.50 |
|
|
2100.50 |
2.6 |
16,541.00 |
|
Jul 13 11 |
26.90 |
Sold 10 Covered Calls August 26 @ 1.34 |
|
|
19.50 |
|
|
1320.50 |
3.4 |
17,861.50 |
|
Jul 18 11 |
26.44 |
Bought to close 3 Naked Puts 20AUG11 $23 @ .08 |
|
|
10.75 |
|
|
(34.75) |
(0.50) |
17826.75 |
|
Aug 4 2011: Just like the
Intel Stock
trade Microsoft too could not withstand the
selling today. It fell 3.64% and now sits at the 200
day moving average. I did a lot of trades today to
free up capital and prepare for any further selling.
The stock could see a bounce up over the next few
days but then I think the stock could be heading to
at least $24.00 in any bear market. I
unwound my covered call trade even though I believe
the better thing would be to sell 1000 shares and
and close the $25 covered call but hold the
remaining shares and retain the $26 covered call,
but after looking at my position I think I prefer to
hold the Jan $26 puts which basically if assigned
will cost me nothing as I have earned more than the
cost of the 600 shares. That doesn't mean I am just
going to let them be assigned. I plan to keep
rolling them as we get nearer to January.
 |
|
Aug 4 11 |
26.70 |
Bought to close 3 naked puts Oct 21 at .23 |
|
|
10.75 |
|
|
(79.75) |
(1.2) |
17747.00 |
|
Aug 4 11 |
26.65 |
Sold 2000 shares at $26.65 |
|
|
7.00 |
|
53293.00 |
453.00 |
|
18200.00 |
|
Aug 4 11 |
26.65 |
Bought to close 15 Naked Puts Aug 24 at .10 |
|
|
25.75 |
|
|
(175.75) |
|
18024.25 |
|
Aug 4 11 |
26.00 |
Bought to close 10 Covered Calls Aug 26 at .68 |
|
|
19.50 |
|
|
(699.50) |
|
17324.75 |
|
Aug 4 11 |
26.00 |
Bought to close10 Covered Calls Aug 25 at 1.31 |
|
|
19.50 |
|
|
(1329.50) |
|
15995.25 |
|
Sep 6 11 |
25.20 |
Sold 10 Puts 17SEP11 $23 at .22 |
|
|
19.50 |
|
23019.50 |
200.50 |
0.87 |
16195.75 |
|
Sep 6 11 |
25.22 |
Sold 10 Puts 22OCT11 $22 at .31 |
|
|
19.50 |
|
22019.50 |
290.50 |
1.3 |
16486.25 |
|
Sep 16 11 |
27.12 |
Expiry: 10 Puts 17SEP11 $23 expired |
|
|
|
|
|
|
|
|
|
Oct 21 11 |
27.16 |
Expiiry: 10 Naked Puts Oct $22 expired |
|
|
|
|
|
|
|
|
|
Nov 9 11 |
26.13 |
Sold 5 Naked Puts 17DEC11 $24 at .33 |
|
|
13.25 |
|
12013.25 |
151.75 |
1.2 |
16638.00 |
|
Nov 21 11 |
24.95 |
Sold 5 Naked Puts 17DEC11 $23 @ 20 |
|
|
13.25 |
|
11513.25 |
86.75 |
0.75 |
16724.75 |
|
Nov 25 11 |
24.30 |
Sold 5 Naked Puts 17DEC11 $23 @ .23 |
|
|
13.25 |
|
11513.25 |
101.75 |
0.88 |
16826.50 |
|
Dec 16 11 |
26.00 |
Expiry: 10 17DEC11 $23 puts expired / 5 17DEC11 $24
puts expired |
|
|
|
|
|
|
|
|
|
Dec 19 11 |
25.55 |
Sold 10 18FEB11 $23 puts @ .35 |
|
|
19.50 |
|
23019.50 |
330.50 |
1.4% |
17157.00 |