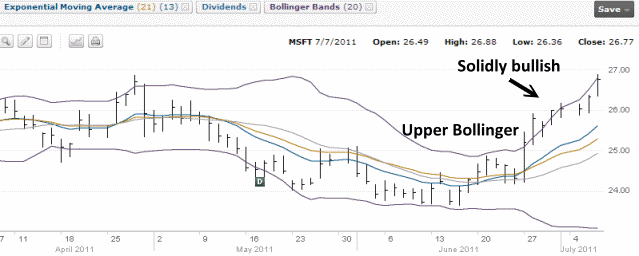
The chart below tells the story about this quick
trade. The purpose of writing this is to show the
technicals tools used to determine price points and
timing to get into the trade and out of the trade.
It is also important to mention that this was to be
a short trade of no more than a few days at best. It
is important to put in place PRIOR to the trade,
what the plan is, the goal and objective. My PLAN
was a short trade of only a few days at best and not
over the weekend, the GOAL was 2 to 3
percent with a downside target of no more than
$25.00 or a loss of about 3.8% or $1000 being
acceptable as I have made a good return to date in
my Microsoft trade. The OBJECTIVE was to hold the stock
while it clung to the Upper Bollinger Band and wait
for signal of overbought or see a trend stall or change
which would be the timing signal to sell.
On the 27th of June the Stock took a big move
higher and broke through the Upper Bollinger
Band. Since then the stock has remained glued to
the Upper Bollinger Band. It is solidly bullish. A
good indication to buy the stock.

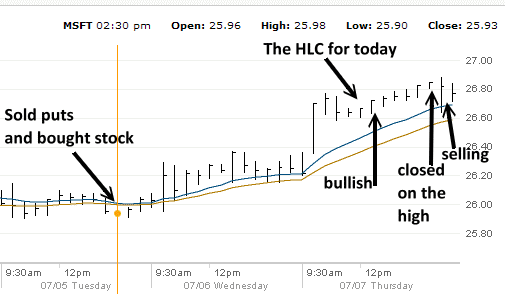
On July 5 when the stock moved lower in mid
afternoon, I sold my puts and bought the stock. I
then added the HLC charting tool after working this
past weekend with an investor friend when
we wrote the 5
part article on his Cisco trade.I was impressed
with using the HLC charting to follow the momentum
in the stock when he did his Cisco trade. I applied
it to my Microsoft trade to see how it might assist. I knew this would only be
a trade for a couple of days (The Plan). I do not want to carry
this trade beyond tomorrow (again THE PLAN). In the chart below you
can see how all day the HLC showed buying activity
near the high as the afternoon progressed. The third
last indicator shows a closing right on the high,
but then no follow through. I sold at that moment.

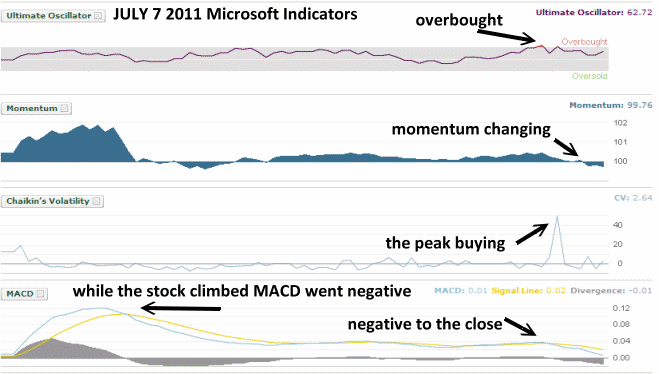
Below are today's indicators (July 7 2011). I knew I
did not want to carry this trade over the weekend (The
Plan). I
was looking for any weakness to sell my shares (The
Objective). I am
not a stock holder but prefer to trade the shares
quickly and get my capital back. The trade was
already up over 2% (The Goal)
The first clue was MACD. From the mid-morning it
went negative and despite the rise in the stock as
the day progressed it refused to go positive. You
would have thought that all the buying in late
afternoon would have pushed it back positive, but it
only crossed for a brief few minutes and then went
negative. I sold at that moment. Into the close MACD
went more negative perhaps an indication of some
selling tomorrow.
Here are the other indicators. A number of times the
Ultimate Oscillator bumped up against overbought. By
the mid-afternoon with the "closed on the high" on
the HLC chart above, the Ultimate Oscillator flashed
overbought. Momentum changed right after. Chalkin's
Volatility shows the peak buying and then it
dropped.

This is not an indication that the stock is due
to "correct", but it may have more difficulty
climbing higher from here. While it probably will
climb higher, Microsoft's stock may now find any
move higher is not going to happen as quickly. In
other words the big jump from oversold back at the
end of June, is over.
You can see
this trade here, in the overall Microsoft chart for
the year. SUMMARY
I have lots of puts in Microsoft and plan to keep
working those positions. I will add more as the
opportunity arises and close early if premiums
collapse. Meanwhile though it has been a great
stock. Imagine. I started right after the tech
bubble burst in 2000. It has been 11 years of annual
double digit returns. You can see how easy sometimes
a trade can be when the Plan, Goal and Objective are
laid out clearly in advance of the trade. These
simple parameters can be applied to any trade to
remove emotion and attain success either through a
profit or to control any loss. Question From A Reader
I didn't look at the minute by minute option prices, but I assume you could have bought Jul
$15 deep in the money Calls and gotten similar (or better percentage) results.
Why did you buy stock instead? It's not like you were going to hold it for a long time, so premium erosion wouldn't come into play.
Question From Bill.
That’s a good question Bill. The reason is pretty
simple. The call may have returned slightly better
than the stock however in a downturn I always feel the stock is
better than the call. The call can lose more value
than the stock and the stock has other possibilities
available to rescue the trade should the stock take
a tumble beyond my loss ceiling.
I have the capital available to buy the stock.
Whereas for other people with less capital
purchasing the calls may make sense. I have found
though, that many people over extend when it comes
to calls (and puts) just due to the price. With the
stock at $25.99 the cost for 1000 shares is about
$26,000. To purchase the deep in the money $15.00
call was $11.15 for $11,150.00. I have seen a lot of
investors step up and buy 15 call contracts because
the cost is still just $16,725.00, considerably less
than my $26,000.00 in purchase. However if the stock
tumbles, they either end up getting out with a
larger loss if they close as now they are closing 15
contracts rather than 10, or they exercise on more
shares than they wanted.
As well, just a personal observation, it is
surprising how many investors talk about buy deep in
the money calls, but when it comes to laying out
$11.15 per contract, they decided to move higher,
say perhaps the $20.00 and pay a little bit more
premium for the call. This begins to negate the
value for purchasing a deep in the money call in the
first place.
It again comes down to the plan, goal and objective.
I am pretty conservative with my plans. I like to
control risk as much as possible and I have had
great luck over the years with buying stock versus
buying calls. While the technicals told me the stock
was moving higher, there is never a guarantee. You
would be surprised at how often I have bought stock
for a quick jump only to see the stock bump up and
then sell off. In my case, Microsoft began the
uptrend on June 27. I didn't buy in until July 5.
The rally could have stalled on July 6 and ended on
July 7. Nothing is foolproof so I hate making a
trade, "hoping" it will work out. I sleep nights
because I have already put in place my strategy in
the event the trade turns against me.
In my plan if the stock fell to 25 I would be out.
The loss would be 3.8%. As well, if the stock moved
from 25.99 to perhaps just 26.10 and I decided to
sell as it is a short term trade, time is against
the call, especially a July call set to expire in a
week's time.
While this next comment would not be as much an
issue for a $15.00 strike call, I think it is worth
mentioning.
Calls had a lot of premium when the stock commenced
moving up. Volatility in the overall market was
higher at that time. However as the stock climbed
and volatility decreased not just in MSFT but the
entire market, the call premiums fell. So if the
stock didn’t move very much in the two or three days
I was willing to be in the trade, then the call
could actually lose value whereas the stock would
still present either a breakeven or a small profit.
For short trades I prefer the stock. I think
everyone has a level that they are good at when it
comes to investing. Mine is selling puts, covered
calls and buying and selling stock. It is only once
in a while when I buy calls.
Buying calls in this case would have worked out, but
of course hindsight is great. I always plan for both
scenarios – a profit and a loss. I find the loss
easier to control or rescue with the stock. Options can really
tumble or grow in value quickly if an unforeseen
event happens and I just never know when that is
going to be the case. With selling puts, if an
unforeseen event happens, such as the Lehman
Brother’s default in 2008, and I get suddenly assigned I am
happy with my position as I know I can work my way
out of it. However with calls I can exercise and
take the shares but I am out the share price where I
exercised and the price I paid for the call option
to begin with. Thanks for your question.
|