I hope you find the information,
concepts, ideas and strategies on my site of value. If you would like to assist me with
the maintenance costs, and time spent keeping my site updated, I
have set up a Paypal account for those who would like to donate.
Thank you in advance. Remember, nothing on my site is financial
advice or recommendations. Investing is risky and losses can be
large. Trade at your own risk.
Read The Disclaimer
Apr 2
2011 / Microsoft Stock Symbol - MSFT
Purchase
Microsoft Stock
VS
Selling Microsoft Options
The Ultimate Utility Stock
Selling Microsoft
Options - The Ultimate Utility Stock
More
than a decade ago I contemplated whether to purchase
Microsoft stock.
I had been
following Microsoft stock prices for over a year and
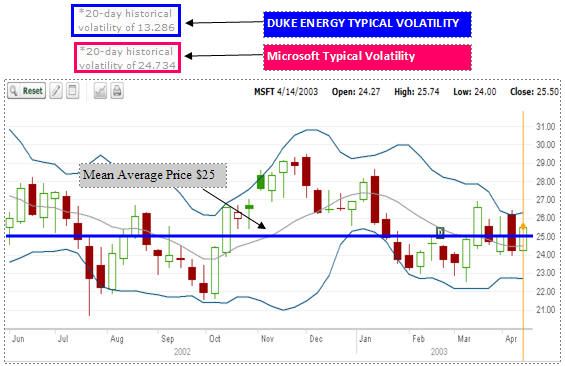
often contemplated buying Microsoft stock. Below is
a chart I made in 2003. I noticed that Microsoft had
a mean average price around the $25.00 range. If I
was going to purchase Microsoft stock it would be at
or below $25.00. However I was looking for a long
range position and wanted Microsoft stock to be a
core holding in my portfolio for a number of years.
Being an option investor I also had plotted the
options for many months and what I noticed was that
Microsoft typically had volatility above 20 percent.
Yet the stock did not go anywhere. In April 2003 I
could have bought Microsoft stock at $24.50. Instead
I decide not to purchase Microsoft stock, but to
sell Microsoft put options until I was assigned
shares. If shares were assigned I would then sell
covered calls.
Within a year I
had made 17% return on selling Microsoft put options
and I still had not been assigned shares. The stock
meanwhile had gone nowhere and it occurred to me
that Microsoft was more a UTILITY
stock than a tech stock. This giant of a
corporation is an enormous cash machine with a
multitude of products that generate significant
profit margins but with a stock price history of
being stuck in a range.
A utility company
generally provides a steady increase in earnings year after year and
they tend to trade in very narrow ranges with a
slight bias to the upside. For example DUKE ENERGY
CORP (DUK) could have been bought in April of 2003
for around $15.70. Today 8 years later it is around
$18.00. With a nice stable dividend and a bit of
capital appreciation, this is what most utility
stocks should provide. It is the reason many people
own utility stocks.
Looking at Microsoft stock prices in April 2003 I
could had purchased Microsoft stock for around $24.50. Now
8 years later it is trading
around $26.00. There has not been a significant
change in Microsoft stock prices. But there is a significant difference
between a utility stock like DUKE and a stock like
MICROSOFT. It is VOLATILITY. If you look at the
chart above you can see the volatility for Microsoft
in pink and for DUKE Energy in blue, back in April
2003.
DUK is usually around
14% in volatility, whereas MSFT is usually around
22% and has many periods every year when it can
average above 28%. This means that Microsoft Stock
option premiums are far greater than DUK or most
utility stocks. This makes Microsoft Stock a prime
candidate for repeat selling of put options and
excellent for my reverse naked put ladder strategy.
It was obvious that there was no reason to purchase
Microsoft stock.
Many
investors continue to buy Microsoft stock waiting for
that big move to $30 or $36 as most believe it is
undervalued. Microsoft board of directors must also
believe this as each year they continue to buy back
their own shares, reducing the float of shares. Yet
despite this the stock has stayed in a trading range
since it did a 2:1 split in Feb 2003.
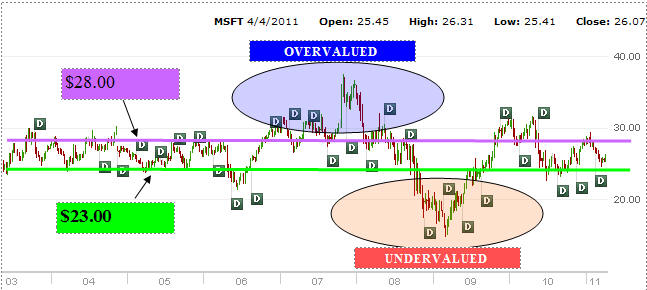
The chart below provides a
Microsoft Stock Analysis for the past 8 years. This
chart is well worth examining. Microsoft stock
has spent most of the past 8 years trading within a range of between $28 on
the high side to $23.00 on the low. By studying this
chart I can derive quite a bit of information which
will assist me. Here is what I can learn from the
Microsoft stock analysis chart such as the one
below:
1) I
can sell Microsoft put options comfortably within that range
although it is best to stay below $27.00.
2) I know
that anytime the stock is over $28.00 it is
overvalued and I would be better served by selling
puts back within the trading range by going
further out in time.
3) I can see that anywhere
below $20.00 could be a good point to buy shares in
lots of 100 so as to accumulate shares slowly when
it is undervalued. However rather than purchase
Microsoft stock I normally sell naked puts when it is
undervalued as I can stay closer to at the money as
the stock declines, making for very large put
premium income.
4) The chart gives me great comfort
when my naked puts get caught in the money, such as
my July 27 naked puts which
you can see
here in my latest Microsoft Stock chart showing my trades. I know that I can continue to
roll those naked puts and work my way lower and
eventually they should end up out of the money.
It's
a pretty simple trade staying within Microsoft stock's
range over the past 8 years. I have only been
assigned shares twice. Once in 2006 and and in fall 2008
during the bear market collapse. It became obvious early
into this trade that there was no reason for me to consider
a purchase of Microsoft stock. Instead through selling
options I have not had a year when I earned less than double
digit returns. Microsoft stock truly is the ultimate utility
stock.