|
The first thing I will do in a market correction
or bear market, is reduce the number of puts I
sell. Before June option expired, I was holding
18 naked puts. With the recent downturn I will
reduce the number of puts to probably around 10.
This means that should stocks really tumble, I
will have cash available to take advantage of
"fire sale" prices in stocks.
Put premiums are increasing almost daily now, so
I want to continue to sell puts in VISA but I
need to determine the safest strike for the
summer period but at the same time I want to
earn decent premiums. To try to
figure out the best put strike to sell, I need to decide
what is a realistic VISA stock value.
Personally I think probably around the $68 to
$70 range is fair value.
While resistance and
support numbers are of some significance, in
down markets stocks can slice right through
support levels, particularly in panics.
Instead I
prefer to look at the stock through charts and technical tools and then decide what levels to
sell puts at.
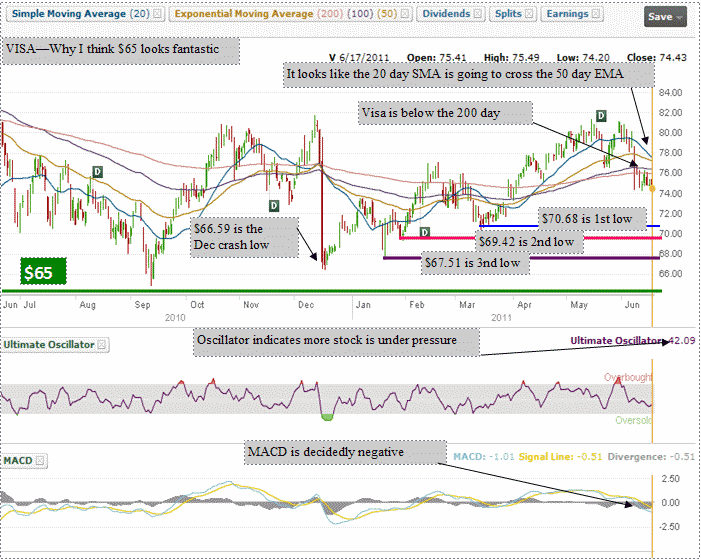
The chart below shows the past year for VISA. Visa Stock
is already below the lows of mid-April.
Each previous low is important as the stock retracing
the uptrend it was in. I plot out on the chart the
previous lows. Since we are already through the most
recent lows, the next low is
at $70.68. This goes back to March and I have labeled
this the 1st low.
The second low goes to Jan 28 2011
when the stock reached $69.42.
The third low is $67.51
which occurred Jan 20 2011.
Of other significance is the
Dec 16th crash which saw the stock fall to $66.59.
Presently VISA is below the 200 day average and it looks
like the 20 day SMA is going to cross the 50 day EMA.
This is a pretty bearish sign.
On top of all this, the Ultimate Oscillator is at 42.09
which shows the
stock is under pressure and falling. MACD is decidedly
negative at -0.51. While both are momentum followers,
they also are pretty good at indicating investor
sentiment and stock direction, which for now appears to
be down.
Looking at my charts and the options available to sell,
I see that the $65 strike for September has a 2.3%
return. The stock has also not been that low for the
past 12 months.

I could wait a while to see how low VISA stock could
fall over the next few weeks, or I could take my capital
and sell some puts now and hold for a while longer,
before selling more puts.
At $65,
the stock looks fantastic. In my opinion not only does
the stock look very strong at $65, but I think the
chance of the stock falling this low is not great AND if
it did, I will be getting the stock at the lowest level
for the entire past 12 month period.
The question then is, will this market downturn, become
nasty and move stocks a lot lower than anyone expects?
Aside from the Greek debt crisis, I don't think stocks
can fall more than 20%. At 20% that would be a serious
correction.
VISA's most recent high was at $81.00. At $74.40 - the
stock is already down 8%. If the stock fell to $65, that
would be an additional 12.6%. This would bring the total
pull back to 20%. Based on this, I think $65 is a pretty
safe strike for me to sell puts against.
In order to add another layer of comfort to my decision
to sell the $65 strike, I look at the stock chart during
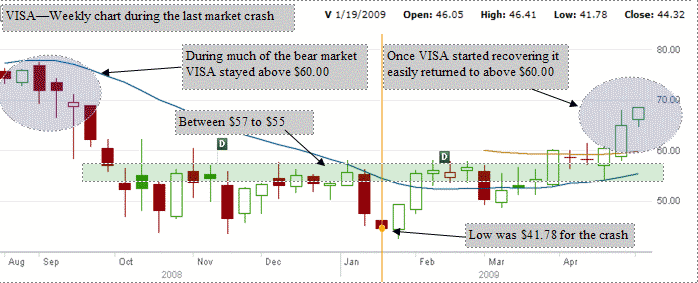
the most recent bear market in 2008 - 2009. Below is
VISA's Stock chart for the worst period of the last bear
market.

I can see that until the panic from Oct 2008 to March
2009, the stock stayed above the $60 value. Then during
the crash the stock fell on average between about $45
and $57. It took a market crash to push the stock below
$60.00. Meanwhile when Visa began to recover, the move
back above $60.00 was swift.
This adds that final layer of comfort. After looking at
the above charts, I believe $65 is a pretty decent
strike during the summer period, even if the market
falls another 10% from here. If VISA falls steeper than
expected, I have a nice pile of cash ready to buy some
VISA shares at bargain basement prices.
To start off, I sold 5 puts for September $65 at $1.50.
I will continue to monitor VISA and sell more puts at
$65 if the stock falls over the next few days. I am
hoping to sell the August $65 if the premiums reach
above $1.00.
This type of charting can be used on any stock to assist
an investor in deciding the best balance between risk
and reward when selling put or call options, during a
market correction or even a bear market.
RETURN TO VISA 2011 TRADES
|