 |
 |
 |
 |
 |
 |
 |
 |
 |
 |
 |
| Jan 21 11 |
78.50 |
STO 10 Naked Puts Feb $75 @ .55 |
0.73 |
|
|
19.50 |
|
|
530.50 |
7284.75 |
| Jan 21 11 |
78.80 |
BTC 10 Naked Puts Feb $70 @ .14 |
(0.20) |
|
|
19.50 |
|
|
(159.50) |
7125.25 |
| Jan 25 11 |
78.30 |
BTC 10 Naked Puts Feb $75 @ .15 |
(0.20) |
|
|
19.50 |
|
|
(169.50) |
6955.75 |
|
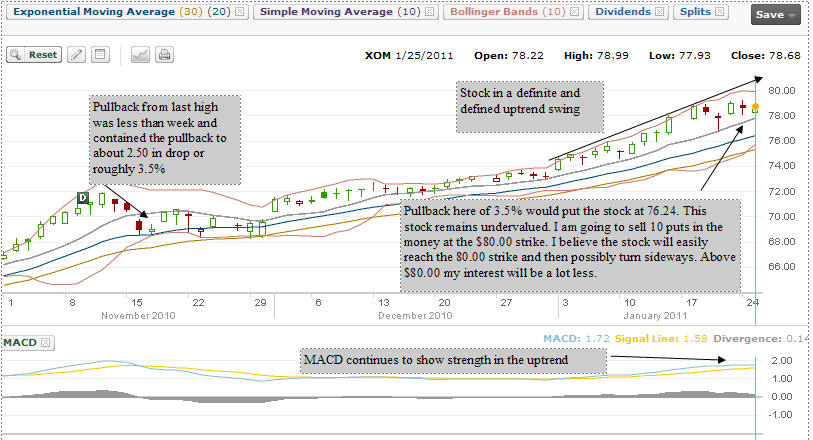
JAN 25 2011: Each roll higher has met with success. It may
seems like luck, but actually there is real strength in the
stock's uptrend. The last pullback in November saw a drop of
about 3.5%. Since then the stock has been in a strong
uptrend. I believe weeks ago I could have sold in the money
naked puts and watched the stock move above my strikes. It
is obvious to me that this stock has strong support and will
easily push above $80.00. If not by Feb expiry then
certainly into March. The strategy of selling out of the
money naked puts is no longer as worthwhile as the strikes
available for options are $5.00 apart and premiums therefore
are best At The Money rather than out of the money. I am
becoming less interested in the stock at these levels
because of that. I will take one last leap and close my Feb
75 naked puts and move to Feb 80 and sell in the money for a
much better return. From here though I may end up closing
this trade and moving to another stock. My reasons are
obvious. The stock has had a terrific move higher and at
these lofty levels, the option premiums are not worthwhile
unless I can continue to sell in the money puts. But I am
not interested in being assigned shares at this level should
the stock pullback.
|
| Jan 25 11 |
78.05 |
STO 10 Naked Puts Feb $80 @ $2.55 |
3.1% |
|
|
19.50 |
|
|
2530.50 |
9486.25 |
| Feb 2 11 |
83.70 |
BTC 10 Naked Puts Feb $80 @ .30 |
(0.375) |
|
|
19.50 |
|
|
(319.50) |
9166.75 |
FEB 2 2011:
TAKING A BREATHER IN XOM.
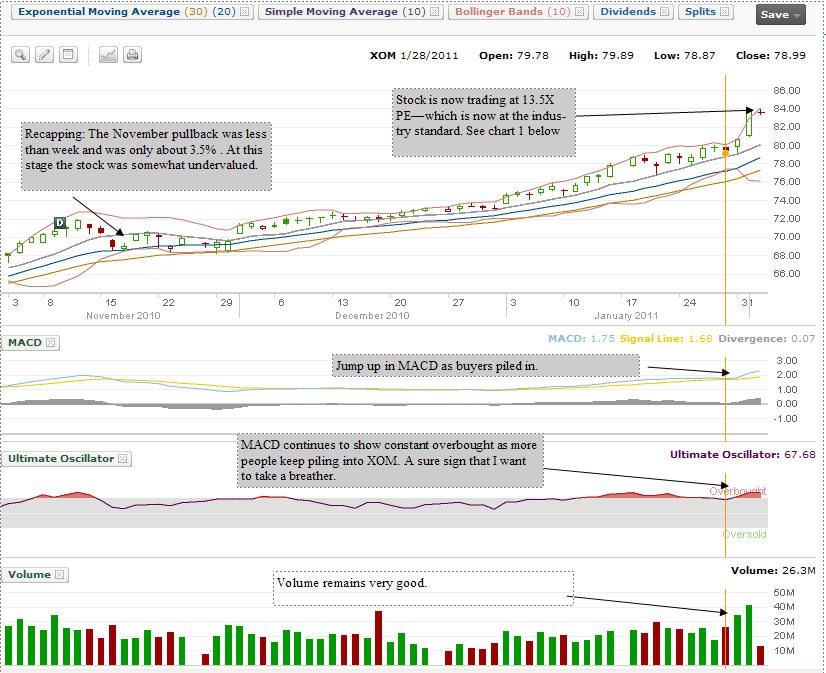
There are enough warning signs for me to close my naked puts
on XOM and pull my capital out of the stock at this stage.
It has been another dramatic rise for XOM and I am sure
there is still more upside left, but with MACD flashing
OVERBOUGHT every day, and more and more people piling into
XOM, it is time for me to close my naked puts and get out. I
will wait at the sidelines to see if the stock can pullback
to the $80.00 mark before marching higher again. Below is
today's chart. We have not had much of a breather in the
rise since November's small 3.5% pullback. On Friday with
the plunge in the overall market, MACD turned down, but it
is right back up in the last two sessions as more buyers
keep getting into the stock. Volume shows all the buyers
flocking to XOM. That's another warning sign telling me that
a pullback could take the stock lower than 3.5%.
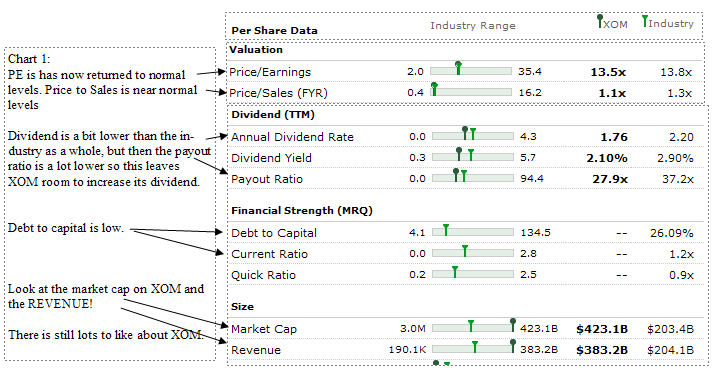
Here are the stats on XOM and part of the reason why I think
a break to the sidelines for me, is in order. When I was
first interested in XOM last year, the stats were much
better. XOM was trading BELOW all the industry standards and
the PE was trailing by a wide margin. Today XOM has
recovered to the rest of the industry. It still has lots of
room to grow, but my interest is a lot less with these type
of "normal" stats.
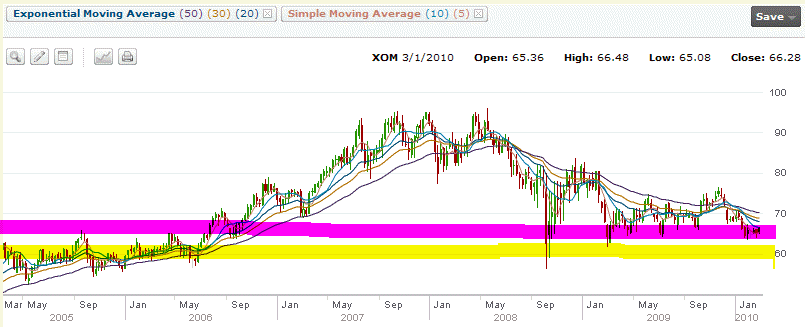
Do you recall the 3 year chart when I first was interested
in XOM? Here is the chart from 3 years back and now at
$83.00 the rallying is maturing. Therefore option premiums
are also declining and with option strikes at $5.00
increments, it makes selling out of the money for half a
percent return, not worthwhile. Getting half a percent a
month is fine, but not when I am sitting with a stock that
could fall from $83.00 to $75.00 overnight. So now the
strategy changes.
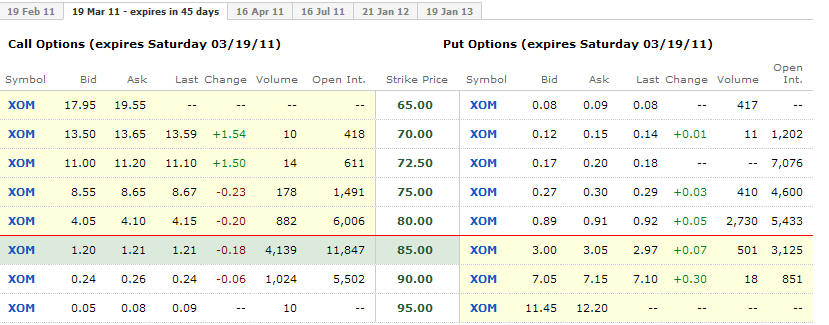
Here are the options for today Feb 2 2011. The STOCK is
trading at $83.65 at the time of my generating these
options. These are MARCH puts that expire in a little over a
month. The $80.00 put is now generating about 1%. Is it
worth selling for a 45 day exposure at these levels for
$80.00? No. BUT the strategy changes to one of watching for
opportunities:
1) Should the stock fall to $80.00 or lower, than I would
sell the $80.00 for larger premiums as I believe the stock
will recover to $80.00 easily.
2) Should volatility pick up, then premiums could again make
it worthwhile to sell short term puts, one month out.
3) On a pullback it is best to sell smaller quantities of
put contracts AT SPECIFIC STRIKES as the stock reaches that
strike. For example, if XOM falls to $79.50 - then I would
sell 5 contracts at $80.00. If XOM falls to $75.00 then I
would sell 5 contracts at $75.00.
4) With strike increments being at $5.00 a piece, it is
better to stay on the sidelines and wait for opportunities.
Meanwhile I can deploy some of the capital I had set aside
for XOM, on different trades and possibly just keep back
enough for 3 to 5 naked puts.
|
|
Feb 10 11 |
81.68 |
STO 10 Naked Puts Mar 80 @ 1.78 |
2.35% |
|
|
19.50 |
|
|
1760.50 |
10927.25 |
|
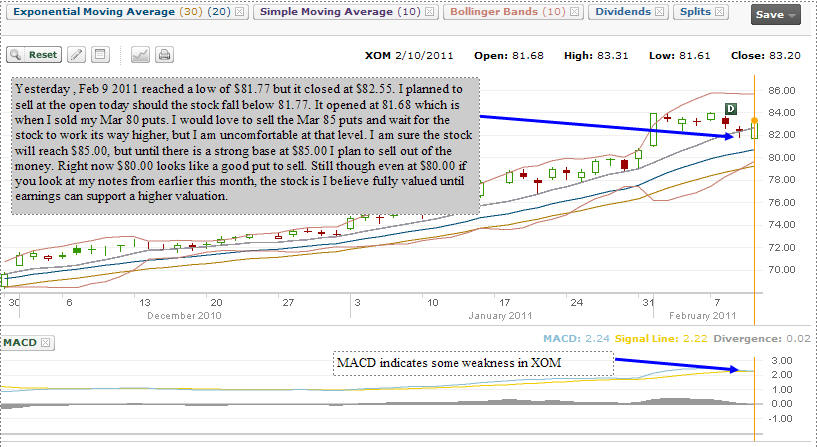
Feb 10
2011: Back into XOM. The weakness this morning was
perfect for my naked puts for March at the $80.00
strike.
 |
|
Mar 14 11 |
82.35 |
BTC 10 Naked Puts Mar 80 @ .65 |
(0.8%) |
|
|
19.50 |
|
|
(669.50) |
10257.75 |
|
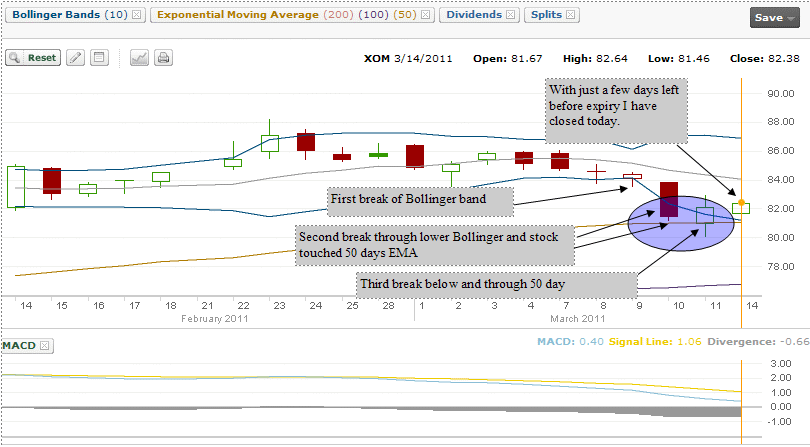
March 14
2011: The past three days have flashed a warning
that XOM is under pressure and will probably fall
further. You can see on my chart that the stock each
day is going further through the lower bollinger and
yesterday the stock broke through the 50 day EMA.
With just a few days to expiry and the stock on a
bounce up today, I bought and closed my March 80
puts. I will wait a few days to see if the stock
falls further and then sell into April.
|
|
Mar 16 11 |
78.90 |
STO 5 Naked Puts Apr $75.00 @ 1.18
COMMENTS: I sold just 5 Naked Puts and held the rest
back in case XOM should fall further allowing me to
sell naked puts below $75.00 |
1.5% |
|
|
13.25 |
|
|
576.75 |
10834.50 |
|
Apr 15 11 |
84.29 |
Expiry: 5 Naked Puts Apr 75 expired |
|
|
|
|
|
|
|
|
|
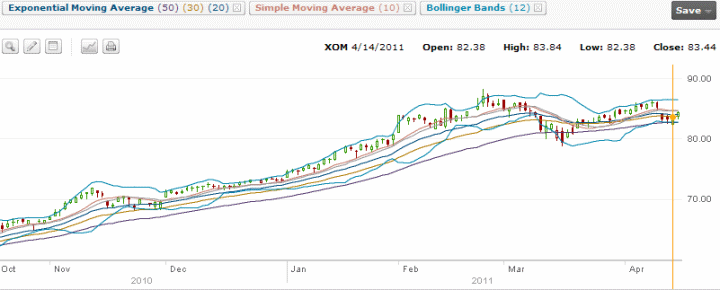
April 15
2011: Just yesterday April 14, the stock closed at
83.44 but hit an intraday low of $82.38. The stock
is sitting on the lower bollinger and the 10 day
Simple Moving Average is pushing down. I see no
point in selling the $82.50. It is still better to
stay at $80 or below.
|
|
Apr 15 11 |
83.50 |
STO 5 Naked Puts May $80 @ .88 |
1.06 |
|
|
13.25 |
|
40013.25 |
426.75 |
11261.25 |
|
May 20 11 |
81.57 |
Expiry: 5 Naked Puts May $80 expired |
|
|
|
|
|
|
|
|
|
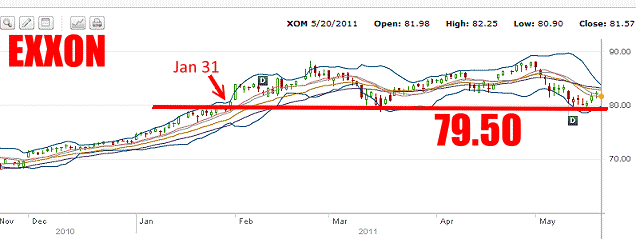
May 20
2011:
Exxon is a
bright spot in my trades as it has pulled back 10%
from its most recent high and allowed me to stay
with the 77.50 and 80.00 strikes. If you recall from
my XOM trade comments back in Feb, I expressed
concern with the stock above 83.00, but back at
80.00 I believe the stock has good opportunity to
recover to 80.00 should the stock fall lower.
Therefore I can continue to put additional capital
into my Exxon trade which will assist those trades
that are not generating enough income. Back on Jan
31 the stock moved above $80.00 and has only briefly
pulled below it. Looking at my chart below, anywhere
below $79.50 will suffice for my trades. Therefore
on any pullback next week I will sell up to 10 put
contracts.
Examining
the 6 month chart below, I can see that support for the
stock is not really at $80 or 79.50, but lower,
around the 70.00 strike. Any move down to that level
would make a compelling case for buying the stock or
selling in the money puts.
To understand this trade
fully you may wish to
read the MAY OPTIONS REVIEW
to understand how I
am deploying all of my capital in my US Portfolio.
|
|
May 23 11 |
80.28 |
STO 5 Naked Puts 18JUN11 $77.50 @ .86 |
1.07 |
|
|
13.25 |
|
38763.25 |
416.75 |
11,678.00 |
|
May 23 11 |
80.27 |
STO 5 Naked Puts 16JUL11 $75.00 @ 1.00 |
|
|
|
13.25 |
|
37513.25 |
486.75 |
12164.75 |
|
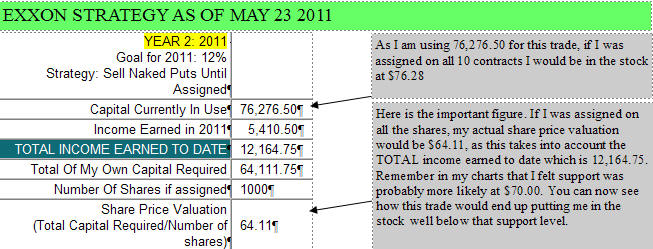
May 23
2011:
One trading session later and the market is selling
off as it worries about a climbing US dollar. I took
full advantage and sold the Jun 77.50 and the Jul 75
puts.
Now let us take a moment
to reflect on the strategy as it now applies to
EXXON. To date I have made $12164.75. If EXXON
should pull back dramatically and I do not have the
advantage of rolling further out for more income, I
could be assigned on all 10 contracts.
That would put me
in the stock at 76.28.
However taking
into account my TOTAL INCOME EARNED TO DATE, my cost
basis in the stock would be just $64.11. That is
well below where I believe support is for the stock
- namely $70.00.
|
|
Jun 17 11 |
79.02 |
Expiration: 5 Naked Puts 18 JUN11 $77.50 expired |
|
|
|
|
|
|
|
|
|
JUNE 19 11
Patience is a strategy many investors ignore. Exxon
Mobil is a terrific oil company. My naked puts for
June expired releasing $38,750. Now the question is
do I reinvest immediately through selling more puts
or hold and wait to see a clearer direction in the
stock. It is times like these that patience is the
correct strategy to use, My comments and chart are
too long to place with this trade.
They can be read in a separate article here.
. |
|
Jun 29 11 |
79.90 |
Sold 5 Naked Puts 20AUG11 $75.00 @ .92 |
|
|
|
13.25 |
|
37513.25 |
446.75 |
12611.50 |
|
Jun 30 11 |
80.85 |
Bought to close 5 Naked Puts 16JUL11 $75.00 @ .12 |
|
|
|
13.25 |
|
|
(73.25) |
12538.25 |
|
Jul 29 11 |
79.76 |
Sold 5 Naked Puts 17SEP11 $75.00 at $1.19 |
|
|
|
13.25 |
|
37513.25 |
581.75 |
13120.00 |
|
Aug 5 11 |
72.25 |
Sold 5 Naked Puts 22OCT11 $60 at $1.00 |
|
|
|
13.25 |
|
30013.25 |
486.75 |
13606.75 |
|
Aug 5 11 |
74.70 |
Bought to Close 5 Puts 20AUG11 $75 @ 2.29 |
|
|
|
13.25 |
|
|
(1158.25) |
12448.50 |
|
Aug 8 11 |
72.90 |
Bought to close 5 puts 17SEP11 $75.00 at 3.85 |
|
|
|
13.25 |
|
|
(1938.25) |
10510.25 |
|
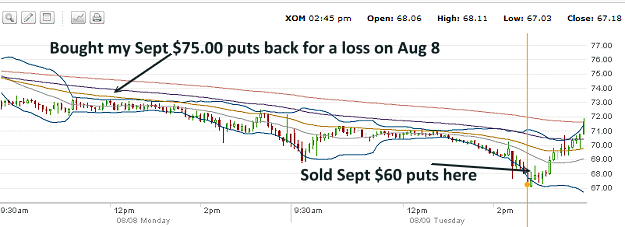
Aug 9 2011
Exxon Mobil fell hard yesterday as the price of oil
continued to decline. I believe I am too high at
$75.00 for September. I already have 5 puts for
October $60.00. I decided to take a loss today and
close my September $75.00 puts.
Today the stock pulled
back hard in the mid-afternoon and I sold the
September $60.00 puts. I sold 7 puts despite closing
5 Sept $75 puts yesterday. It still does not cover
the loss of my buying back the September $75 puts,
but I am quite comfortable staying at the $60.00
strike.
.
 |
|
Aug 9 11 |
67.70 |
Sold 7 Puts 17SEP11 $60.00 $1.51 |
|
|
|
15.75 |
|
42015.75 |
1041.25 |
11551.50 |
|
Sep 6 11 |
70.00 |
Sold 5 Puts 22OCT11 $55.00 @ .54 |
0.93 |
|
|
13.25 |
|
27513.25 |
256.75 |
11808.25 |
|
Sep 16 11 |
74.25 |
Expiry: 7 Puts 17SEP11 $60 expired |
|
|
|
|
|
|
|
|
|
Oct 21 11 |
80.13 |
Expiry: 5 Oct $60 puts expired. 5 Oct $55 puts
expired. |
|
|
|
|
|
|
|
|
|
Nov 1 11 |
75.88 |
Sold 5 Puts 17DEC11 $70 @ 1.38 |
1.9 |
|
|
13.25 |
|
35013.25 |
676.75 |
12485.00 |
|
Nov 1 11 |
75.88 |
Sold 10 Puts 19NOV11 $70 @ .71 |
1% |
|
|
19.50 |
|
70019.50 |
671.00 |
13156.00 |
|
Nov 9 11 |
77.55 |
Sold 10 PUTS 19NOV11 $70 @ .23 |
0.32% |
|
|
19.50 |
|
70019.50 |
210.50 |
13366.50 |
|
Nov 21 11 |
76.15 |
Sold 10 PUTS 17DEC11 $65 @ .31 |
0.49% |
|
|
19.50 |
|
65019.50 |
290.50 |
13657.00 |
|
Nov 25 11 |
74.25 |
Sold 5 PUTS 19DEC $70 @ .55 |
0.78% |
|
|
13.25 |
|
35013.25 |
261.75 |
13918.75 |
|
Dec 16 11 |
80.16 |
Expiry: 10 Naked Puts $65 and 10 Naked Puts $70
expired |
|
|
|
|
|
|
|
|
|
Dec 19 11 |
79.55 |
Sold 10 Puts 21JAN12 $72.50 @ .65 |
0.86% |
|
|
19.50 |
|
72519.50 |
630.50 |
14549.25 |