|

|
YUM! BRANDS |
|
|
My Perspective |
|
Yum Brands controls 5 different concepts. KFC, PIZZA
HUT, TACO BELL, Long John Silver and A&W. YUM Brands now has 36,000 restaurants in 110 countries
and continues to open more outlets every month.
Through the five concepts of KFC, Pizza Hut, Taco Bell, LJS and A&W (the Concepts), the Company develops,
operates, franchises and licenses a worldwide system of
restaurants, which prepare, package and sell a menu of food
items. The Company either operates units or they are
operated by independent franchisees or licensees under the
terms of franchise or license agreements.
In addition, the
Company owns non-controlling interests in Unconsolidated
Affiliates in China who operate similar to franchisees. YUM's business consists of three segments: United States,
YUM Restaurants International (YRI) and the China Division.
The China Division includes mainland China (China), Thailand
and KFC Taiwan, and YRI includes the remainder of its
international operations.
Recently I
watched a special on TV about Asia and people are lined
up outside KFC, Taco Bell and Pizza Hut. In China KFC is
incredibly popular. The sales figures show that while
YUM is growing slowly in North America, they are
growing rapidly in Asia. This
company is growing.
McDonalds has a market cap of 60.91 Billion. Yum Brands is
now at 15.64 Billion and growing faster than McDonalds.
Every year Yum Brands has increased its market cap. It
is now 25% as large as McDonalds. It is definitely a
large cap player and will be around for quite some time.
While I am not interested in owning this stock, I don’t expect any
kind of dramatic sell off in the stock. |
Terms
Of Use |
|
By using this site,
you agree to be bound by its terms of use.
The full terms of
use can be read here.
If you do not agree to the terms of use, do not access or use
this site.
Nothing presented is financial advice, trading advice or
recommendations. Everything presented is the author's ideas
only. The author accepts no liability for its use including
errors and omissions. You alone are solely responsible for your
own investing and trading. There are considerable risks involved
in implementing any investment strategies and losses can be
large. Trade at your own risk. |
|
| |
YUM! BRANDS (YUM) - 2010
ONGOING EVALUATION
& TRADE
My goal for YUM is to collect income from naked put
writing. When the stock gets over-valued (in my opinion)
I will revert back to selling laddered naked puts to keep
myself below the stock price to try to avoid being assigned
at a too high a level. Should I get assigned I
should be able to sell the stock through covered call
writing as I will be in the low range for this stock.
Yum's chart looks promising for selling naked puts
consistently.
|
 |
 |
 |
 |
|
|
 |
|
|
Should you find my strategy and ongoing evaluation of
this trade of value I hope you will consider a tip
for the time I spend detailing out this trade.
I have set up a Paypal account for those
who would like to donate. Thank you in advance. Remember, nothing on my site is financial advice.
They are just my ideas and opinions. Investing is risky and losses can be large. Trade
at your own risk.
Read the
terms of use
|
|
YEAR 1: 2009 - Trade Commenced Aug 3 2009
Goal for 2009:
5% (5 months)
Strategy: Sell Naked Puts Until Assigned |
|
|
Capital In Use At End Of 2009 |
30,000.00 |
|
Income Earned in 2009 (5 months) |
1,397.25 |
|
Return On Capital in 2009 (5 months) |
4.6% |
| |
|
YEAR 2: 2010
Goal for 2010: 12%
Strategy: Sell Naked Puts Until Assigned |
|
|
Capital In Use At End
Of 2010 |
45,000.00 |
|
Income Earned in 2010 |
5964.00 |
|
Return On Capital For
2010 |
13.25% |
| |
|
|
|
|
YEAR - 2: 2010
TRADE COMMENCED Aug 11 2009
GOAL FOR 2010:
12%
ONGOING STRATEGY
- SELLING NAKED PUTS UNTIL ASSIGNED |
 |
 |
 |
 |
 |
 |
 |
 |
 |
 |
 |
| |
|
END OF 2009 -
INCOME $1397.25 |
|
|
|
|
|
|
|
|
| Jan 15 10 |
35.67 |
Expiration: 5 NP Jan 34 Expired |
|
|
|
|
|
|
|
|
| Jan 19 10 |
35.58 |
STO 5 NP Feb 34 @ .40 |
1.1 |
|
|
13.25 |
|
|
186.75 |
1584.00 |
| Jan 19 10 |
35.58 |
STO 2 NP Feb 35 @ .65 |
1.8 |
|
|
9.50 |
|
|
120.50 |
1704.50 |
| Feb 19 10 |
33.79 |
BTC 2 NP FEB 35 @ 1.30 |
(3.7) |
|
|
9.50 |
|
|
(269.50) |
1435.00 |
| Feb 19 10 |
33.79 |
STO 2 NP APR 35 @ 2.05 (Keeping in
mind that I am not interested in owning this stock, it makes
sense to buy back these puts and roll out to April for even
more premium) Remembering the goal of NOT ACTUALLY OWNING
SHARES, this makes the decision process easy - just keep
rolling. Should the roll finally not be of any value should
the stock fall too low, then I will have built up enough
premium to reduce my overall cost when or if I am finally
assigned. I have to remind myself of the chart on this
stock... basically it is really going nowhere fast and that
means garnering premiums through continuously selling the
puts. I am spread out now between 32 to 35 with small
positions at 3 varying strikes. This month (Feb option
expiry) two ended up in the money and 1 out of the money. So
I can roll 2 forward and I sell 1 other position 1 strike
lower than the 33, to try to keep at least one position out
of the money. This is kind of like my hedge on this stock.
While other positions may remain in the money and keep
bringing in higher premiums, the out of the money position(s)
bring in less premium but keep lowering my overall entry
position should I get assigned early on the in the money
positions. This approach has worked well for me in the past.
It is true though that if I had all my contracts in together
at one strike, in the money, I would garner more income and
pay less commission, it would also expose me to assignment
at a strike that is higher than the overall position I would
like to take. By hedging myself with 3 different strikes, I
can better control my actual entry cost and keep some of my
capital in reserve through the selling of OUT OF THE MONEY
naked puts. |
5.8 |
|
|
9.50 |
|
|
400.50 |
1835.50 |
| Feb 19 10 |
33.79 |
BTC 5 NP FEB 34 @ .27 |
(0.79) |
|
|
13.25 |
|
|
(148.25) |
1687.25 |
| Feb 19 10 |
33.79 |
STO 5 NP MAR 34 @ .90 (Again this is
the optimum strike point for now, so it makes sense to not
be assigned but to roll forward for more premium. By staying
At The Money, I am getting the very best premium available
on the PUT and continue to increase my earnings, thereby
reducing my overall cost when the day comes to take the
assignment) |
2.6 |
|
|
13.25 |
|
|
436.75 |
2124.00 |
| Feb 19 10 |
33.69 |
STO 4 NP APR 32 @ .70 (With the
stock churning away but going nowhere I am selling my next
set of puts early as I expect the Feb 33 to expire worthless
today. If by chance the stock fell and I was assigned at
33.00 I will take the assignment and sell the stock as soon
as possible) |
2.1 |
|
|
12.00 |
|
|
268.00 |
2392.00 |
| Feb 19 10 |
33.79 |
Expiry: 4 NP Feb 33 Expired |
|
|
|
|
|
|
|
|
| Mar 11 10 |
37.09 |
BTC 4 NP Apr 32 @ .10 |
(0.31) |
|
|
12.00 |
|
|
(52.00) |
2340.00 |
| Mar 11 10 |
37.09 |
STO 9 NP Apr 35 @ .50
COMMENTS: Yum has set a new 52 week high recently and while
I would like to move my put strikes higher I believe that
prudence is to stay at the 35.00. The stock has moved 10% in
one month and I do not believe it can continue. I am selling
the Apr 35 but I will watch and roll this position should it
be necessary if the stock moves lower. I sold 9 puts for
April as I am expecting the 5 NP Mar 34 to expire next week.
I have an offer to close the Mar 34 puts at .04 cents but no
takers yet. I have 2 April 35 puts from my previous trade
(see above) |
1.3 |
|
|
18.25 |
|
|
431.75 |
2771.75 |
| Mar 19 10 |
37.94 |
Expiry: 5 NP Mar 34 expired
Comments: With expiry I now have just two positions and they
have ended up at the same strike - $35.00 |
|
|
|
|
|
|
|
|
| April 6 10 |
39.80 |
REVERSE NAKED PUT LADDER ENDED
RISK AVERSION STRATEGY EMPLOYED
|
|
|
|
|
|
|
|
|
|
RISK AVERSION
STRATEGY EXPLAINED
April
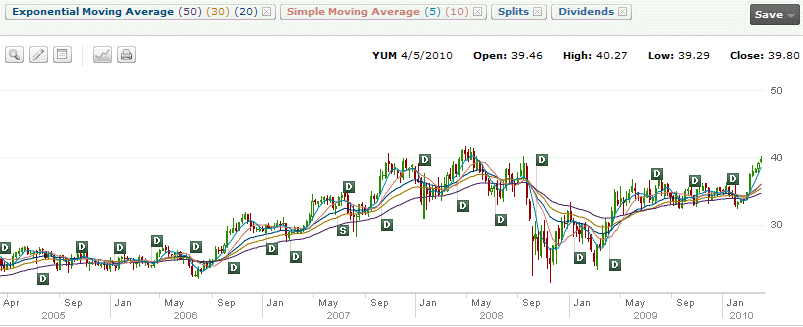
6 2010: Is Yum Becoming Overvalued? - RISK
AVERSION STRATEGY NOW EMPLOYED
Yum is presently back touching the $40.00 value. The
PE is at 17.84 times which is not over high for YUM
but slightly higher than McDonalds 16.5X. Looking at
the 5 year chart above, the stock is
definitely sitting at the top of its past trading
range. Earnings are stronger now than in May 2008 or
October 2007 at which time the stock revisited this
range. Looking at the 3 month chart below, I can see
that the oversold condition has been worked out of
the stock but momentum is definitely slowing. Today
(Apr 6 2010) when the stock moved above $40.00,
large selling volume entered, but the stock actually
closed down just .24 cents or a little more than
0.60% to $39.80. With the strength of the down
volume you would think this stock would have fallen
at least a full percentage point if not more. In
2007 the quarterly dividend was .15 cents. In 2008
it was .19 cents and in 2009 it was .21 cents.
Earnings continue to grow as does the dividend.
Also, like so many USA corporations, much of YUM's
debt has been refinanced at historical low levels
due to the credit crisis and the historic low
interest rates. This means stronger financial
statements for YUM.
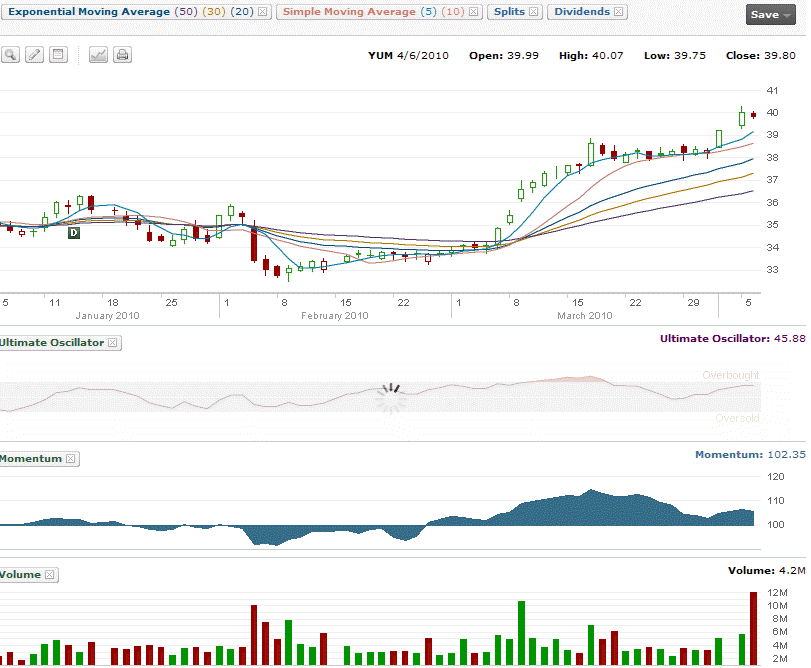
The answer I am trying to determine is if the stock
is over valued or fairly valued. I felt at $35.00
the stock was fully valued and I had hoped to stay
at $35 strike. In order to proceed with further
naked puts, I would have to move to $37 strike to
receive a 1% return. At $37 I am a bit concerned
about a possible pullback. If you look at the 5 year
chart you can see that I liked the $35 strike for
puts as it is was mid-range for much of 2009.
However to continue with YUM, I will have to move to
the $37 strike. I will therefore reduce the number
of naked puts being sold and the amount of capital
being used in this trade. Unless I see a clear move
by the stock to set a new range perhaps between $37
and $42, I cannot justify continuing to sell 15
monthly contracts. As well, my strategy of a
reverse naked put ladder no longer can work as
the advancement of the stock has reduced put
premiums below the $35 strike to amounts not worthy
of selling. Presently going out 4 months and staying
at the 35.00 strike brings in just .50 cents which
is around 0.35% per month or approximately 1.05% per
year. This does not warrant even margin being made
available, let alone actual capital. This means a
change in strategy on YUM to a risk aversion
strategy of selling only those puts that can
generate at least 1% a month. This means reduced
contracts, to help manage the risk of possible
assignment at a higher strike than I would prefer.
With a smaller number of contracts, should I be
assigned at a higher price, I can continue to sell
puts with additional capital, to average in at a
lower price, should the stock fall.
|
| Apr 16 10 |
42.70 |
Expiry: 11 NP Apr 35 expired |
|
|
|
|
|
|
|
|
| Apr 19 10 |
42.44 |
STO 5 NP May 41 @ .60 |
1.4 |
|
|
13.25 |
|
|
286.75 |
3058.50 |
| May 21 10 |
38.77 |
STO 10 NP JUN 38 @ 1.00
COMMENTS: I have rolled down 3 strike positions at a loss of
.10 cents. However the 38 strike is a good spot to be in and
I would own this stock at this price. I have therefore
increased the number of contracts to 10 from 5. Should the
stock recover during the day I will close the May 41 puts as
they are in the money. |
2.6 |
|
|
19.50 |
|
|
980.50 |
4039.00 |
| May 21 10 |
40.15 |
EXPIRY: BTC 5 NP May 41 @ 1.10 |
(2.6) |
|
|
13.25 |
|
|
(563.25) |
3475.75 |
| Jun 4 10 |
40.90 |
BTC 10 NP JUN 38 @ .30
Comments: Originally I sold this put for 1.00 on May 21.
Here I am just a few days later and the profit is 70%. I
have closed these puts to look in the profit and moved to
July 35. |
(0.7) |
|
|
19.50 |
|
|
(319.50) |
3156.25 |
| Jun 4 10 |
40.90 |
STO 10 Naked Puts (NP) JUL 35 @ .50 |
1.4 |
|
|
19.50 |
|
|
480.50 |
3636.75 |
| Jun 21 10 |
43.24 |
STO 10 Naked Puts Jul 40 @ .40 |
1.0 |
|
|
19.50 |
|
|
380.50 |
4017.25 |
| Jun 29 10 |
39.40 |
BTC 10 Naked Puts Jul 40 @ 1.05 |
(2.6) |
|
|
19.50 |
|
|
(1069.50) |
2947.75 |
|
June 30 2010:
Yesterday I closed my July 40 naked puts and rolled to
August 39 for an extra 1.00 in premium. If this volatility
keeps up this could really assist my positions with YUM.
Looking at the chart we may have some clue as to where YUM
could eventually be heading. Back in Jan the stock was
trading between $35 and $36. The 200 and 150 day averages
are between $36 and $38. If it follows much of the market
and falls through the 200 day the stock will probably reach
$36. Meanwhile, presently the stock is oversold as can be
seen on the oscillator. I rolled to Aug 39 today to take
advantage of the premium so hopefully, if the stock climbs
back up, I can buy it back and roll out to September once
July options expire.
 |
| Jun 30 10 |
39.04 |
STO 10 Naked Puts Aug 39 @ 2.00
Comments: I rolled just to 39 to get a high premium. If the
stock falls to 38, I will buy back the 39.00 and roll to 38
if there is enough premium. |
5.1 |
|
|
19.50 |
|
|
1980.50 |
4928.25 |
| JUL 16 10 |
40.07 |
Expiry: 10 NP JUL 35 expired |
|
|
|
|
|
|
|
|
| Aug 20 10 |
41.90 |
STO 10 Naked Puts Sep 39 @ .31 |
0.79 |
|
|
19.50 |
|
|
290.50 |
5218.75 |
| Aug 20 10 |
42.32 |
Expiry 10 Naked Puts Aug 39 expired |
|
|
|
|
|
|
|
|
| Sep 2 10 |
43.20 |
STO 10 Naked Puts Oct 40 @ .65
Comments: With the news about burger king being sold, YUM
should hold above 40.00 for a while. I will be closing my
Sep 39 shortly for .05 cents. I have an order in to BTC at
.05 and I am just waiting to be filled. |
1.6 |
|
|
19.50 |
|
|
630.50 |
5849.25 |
|
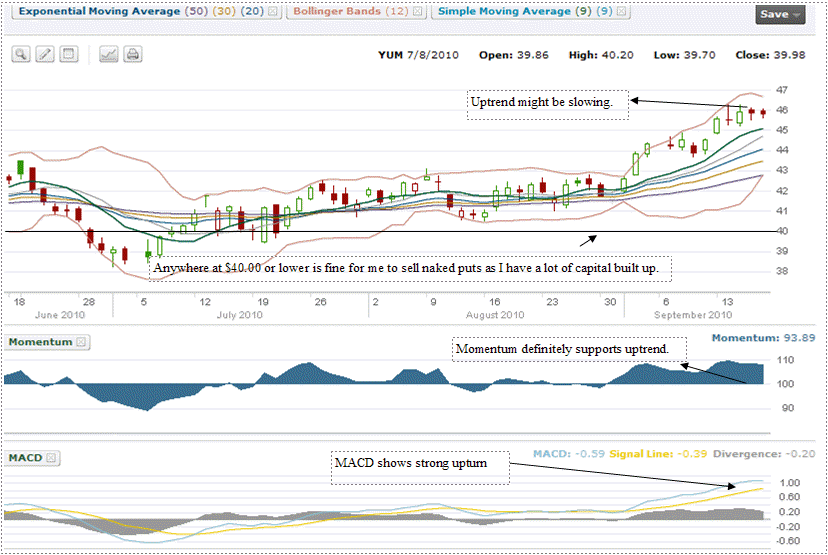
Sep 17 2010: YUM
remains in a strong uptrend, but the charts are showing some
near term weakness would could signal that this uptrend is
slowing or stopping for now. While I am not concerned about
YUM pulling back, there is no indication of this from the
charts. Therefore I closed my Oct 40 puts and moved to Jan
to stay at the 40 level for a little while longer. Once the
charts determine whether or not the uptrend is still intact,
I will close these Jan 40 puts and move higher.
 |
| Sep 17 10 |
45.75 |
BTC 10 Naked Puts Oct 40 @ .18 |
(0.45) |
|
|
19.50 |
|
|
(199.50) |
5649.75 |
| Sep 17 10 |
45.75 |
STO 10 Naked Puts Jan 40 @ 1.04 |
2.6 |
|
|
19.50 |
|
|
1020.50 |
6670.25 |
| Sep 17 10 |
45.75 |
Expiry: 10 Naked Puts Aug 39 expired |
|
|
|
|
|
|
|
|
| Nov 10 10 |
50.88 |
BTC 10 Naked Puts Jan 40 @ .14 |
(0.35) |
|
|
19.50 |
|
|
(159.50) |
6510.75 |
| Nov 10 10 |
50.88 |
STO 10 Naked Puts Jan 45 @ .40 |
(0.80) |
|
|
19.50 |
|
|
380.50 |
6891.25 |
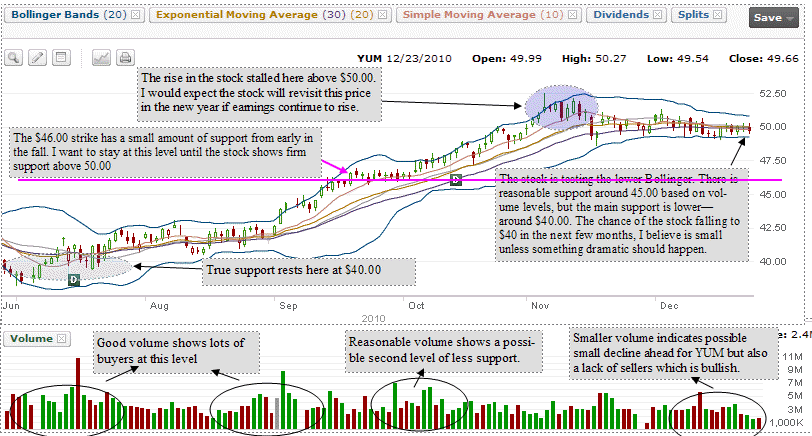
| Dec 23 10 |
49.66 |
BTC 10 Naked Puts Jan 45 @ .13 |
(0.29) |
|
|
19.50 |
|
|
(110.50) |
6780.75 |
| Dec 23 10 |
49.66 |
STO 10 Naked Puts Feb 46 @ .60
COMMENTS: I prefer to stay somewhat out of the money on YUM
as I do not want to get caught in any downturn. However by
the time Jan expiry comes the Feb 46 puts could be worth
just half a percent or less. I closed the Jan 45 puts early
early as the Jan 45 sell of puts was also because of a roll
up, so losing .13 cents to roll into Feb I felt was
worthwhile. |
1.3 |
|
|
19.50 |
|
|
580.50 |
7361.25 |
|
DEC 23 2010:
Reviewing the chart for the past 6 months I can see there is
strong support in the $40.00 range and second support around
the $46.00 level from early in the fall. The recent pullback
from the highs of late fall are to be somewhat expected as
the stock is a little ahead of itself. Earnings though are
strong and YUM! has given forward guidance that they are
expecting strong earnings in 2011 and plan to continue
opening more restaurants, particularly in Asia. Meanwhile I
prefer to stay around the 46.00 strike until I see firm
support at $50.00 and above. I closed now for a small cost
in order to roll out to Feb at the 46.00 strike and capture
the higher premium. If YUM! does not fall further, into
January, the Feb 46 premium will be probably half of what is
now being offered. Meanwhile my Jan 45 strike is a roll up
so I have already had a great January, having "double
dipped" in the month. Looking at the chart below gives a
good idea of how I look at a chart. I can see the support
from the summer and the support in the fall. This is a
typical chart of a company in an uptrend. The stock moves
up, then consolidates and then move higher. It will be
interesting to see if the present pullback is a
consolidation before continuing the uptrend or in fact marks
a high point for the present.
|
| |
|
|
|
|
|
|
|
|
|
|
|