You are here:INDEX > US-STOCKS > INTEL STOCK TRADES 2010 /...
Intel Corporation
About The Company
Market Cap 109.4B
Revenue (FYR) $43.6B
EPS (TTM) $2.01
Shares Out. 5.5B
Book Value $8.97
Div/Share $.72
Payout Ratio 30.5x
P/E 9.9x
Price/Sales (FYR) 2.5
P/Cash Flow (TTM) 6.8x
Operating Margin 35.45%
Debt To Capital 4.1%
Gross Profit Margin 26.28%
Intel Corporation
is a semiconductor chip maker,
developing advanced integrated
digital technology products,
primarily integrated circuits,
for industries, such as
computing and communications.
This is probably the number 1
chip maker to own. It is the
largest chip maker in the world
and although driven by consumer
demand, Intel has a very strong
balance sheet. The Company
designs and manufactures
computing and communications
components, such as
microprocessors, chipsets,
motherboards, and wireless and
wired connectivity products, as
well as platforms that
incorporate these components. It
operates in nine operating
segments: PC Client Group, Data
Center Group, Embedded and
Communications Group, Digital
Home Group, Ultra-Mobility
Group, NAND Solutions Group,
Wind River Software Group,
Software and Services Group and
Digital Health Group.
Terms
Of Use
By using this site,
you agree to be bound by its terms of use.
The full terms of
use can be read here.
If you do not agree to the terms of use, do not access or use
this site.
Nothing presented is financial advice, trading advice or
recommendations. Everything presented is the author's ideas
only. The author accepts no liability for its use including
errors and omissions. You alone are solely responsible for your
own investing and trading. There are considerable risks involved
in implementing any investment strategies and losses can be
large. Trade at your own risk.
INTEL
STOCK - 2010
INTEL
STOCK SYMBOL - INTC
ONGOING EVALUATION
& TRADE
- Year 1
This will
remain an ongoing trade. Intel is the largest semiconductor
chip maker in the world. With a market cap of over 109
billion and a great board of directors, Intel is positioning
itself to continue to dominate the semiconductor industry.
Last year it purchased McAfee Security. With a payout ratio
of just 30.5x and earnings of more than 43.6 billion, Intel
has a gross profit margin of 26.28%. I believe this will
make a long term naked put and
covered call strategy possible.
The plan is to eventually own shares in INTEL but through
the use of other people's capital. To to this
I will start with selling ATM
or ITM Naked Puts and Naked Puts OTM
to eventually pick up the stock. The objective therefore
is to make enough through naked put selling to help pay for
a substantial amount of the capital required to own the
stock. I plan to set a realistic annual goal of 12% while limiting my volatility through the selling of
puts, calls and collecting the dividend if assigned
shares.
Should you find my strategy and ongoing evaluation of
this trade of value I hope you will consider a tip
for the time I spend detailing out this trade.
I have set up a Paypal account for those
who would like to donate. Thank you in advance. Remember, nothing on my site is financial advice.
They are just my ideas and opinions. Investing is risky and losses can be large. Trade
at your own risk.
Read the
terms of use
YEAR 1: - Trade Commenced March 2010 Goal for 2010:
9% (9 months)
Strategy: Sell Naked Puts Until Assigned
Capital In Use At End Of 2010
25,518.50
Income Earned in 2009 (9 months)
4,518.50
Return On Capital in 2009 (9 months)
17.7%
Join The
Options
Forum
I set up a Yahoo forum for those interested in discussing selling stock
options for income including covered
calls, selling naked puts, spreads and other option and stock strategies.
JOIN HERE
TRADE COMMENCED March 10
2010
GOAL FOR 2010:
9%
STRATEGY
- SELLING NAKED PUTS UNTIL ASSIGNED
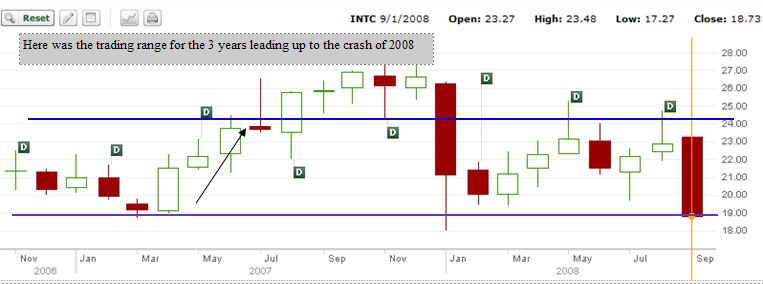
Mar 10 2010 To
start I looked back 3 years on Intel Stock. Up until the crash of
2008 the stock stayed stuck in a nice trading range which
makes puts and call selling viable. The chart below shows
the past 3 years by month. By changing the chart to monthly,
I can see the range more clearly. From Nov 06 to Jul 07
naked puts would have worked out perfectly if I stayed in
the median of around $20.00 to $22.00. From Aug 2007 to Jan
2008 naked puts at the $22.00 range would have still been
viable. The same held true for Jan 2008 to Sep 2008.
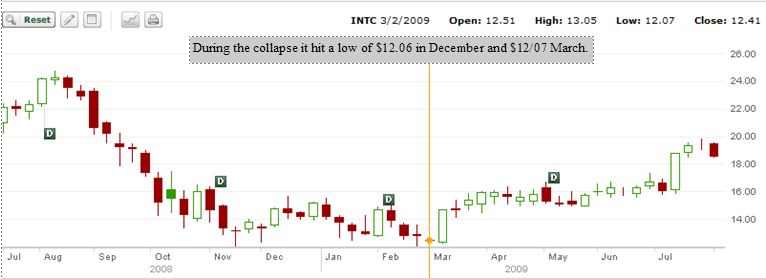
This next chart looks at Intel during the crash of 2008 to
09. The technology stocks lost almost 50% of their value in
the collapse. This is a stark reminder that these stocks are
volatile in a bear market as the believe is simply that a
recession means less sales for technology related items and
therefore a declining valuation on Intel. Look though how
even in November 2008 the stock held on at the 16.00 range
before finally giving way. The more interesting aspect of
the below chart is the quick recovery back to the $18.00 to
$19.00 range.
Mar 10 2010
21.0
STO 5 NP Apr 20 @ .36
13.25
10013.25
166.75
1.66
166.75
Mar 10 2010
21.00
STO 5 NP Apr 19 @ .16
13.25
9513.25
66.75
0.70
233.50
Mar 22 2010
22.27
BTC 5 NP Apr 19 @ .05
(38.25)
(0.40)
195.25
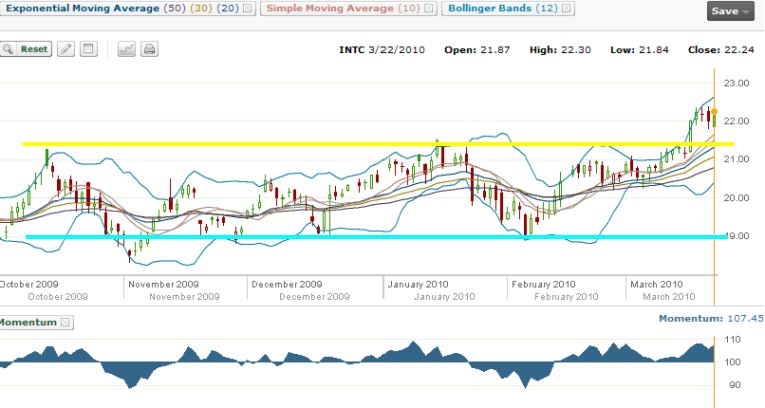
Mar 22
2010: For the past few months the stock has been stuck in
the 19 to 21 trading range and now have broken out. I am
closing my $19 puts early and will move to the $21 naked put
as the stock climbs higher. If it keeps climbing I will sell
out of the money on the stock.
Mar 22 2010
22.27
STO 5 NP May 21 @ .48
13.25
10513.25
226.75
2.15
422.00
Apr 16 10
23.92
Expiry: 5 Naked Puts Apr 20 expired
Apr 16 10
23.92
Expiry: Bought to close 5 Naked Puts
May 21 @ .07
13.25
(48.25)
0.45
Apr 16 10
23.88
Sold (STO) 5 Naked Puts May 22 @ .17
Comments: I have sold just 5 naked puts and will wait for a
pullback to sell the remaining 5 naked putsS
13.25
11013.25
71.75
0.65
445.50
Apr 27 10
23.30
STO 5 Naked Puts Jun 23 @ .77
13.25
11513.25
371.75
3.22
817.25
May 13 10
22.55
STO 5 Naked Puts Jun 21 @ .36
13.25
10513.25
166.75
1.58
984.00
May 21 2010: This is a great company and I plan
to be with it for quite a while. Remember the
goals and objectives of why i am in Intel. If
you forgot them, scroll up the page to read the Goals and
Objectives.
On Friday I was holding 5 NP Jun 23; 5 NP Jun
21; 5 NP May 22. I rolled the May 22 to Jun 22.
The premiums are excellent and made the roll an
easy decision. I also looked at my Jun 21. I had
originally written it for .36 cents. To close it
on Friday cost me .96 cents – so my loss was 60
cents on the buy back. I then sold the same
number of contracts for July 21 at a 1.77 for a
profit of 1.17 or 5.5%.
It’s a simple step to know
how or when to roll the puts.
1)I check the price of the put to buy it
back to see what the loss would be. In my case
.60 cents – or I am losing .60 / 21 (Strike
price) = 2.8% loss.
2)Then check the same price (or if you are
a bit concerned a lower price) in my case 1.77
for Jul 21
3)Figure out what the return is 1.77 / 21
(strike price) = 8.4%.
4)Figure out the time period – I keep it
simple – I am losing 2.8% for a one month
period. I am gaining 8.4% over a 2 month period
or 4.2% per month.
5)The decision is easy – close the Jun put
and sell the July put. I could wait until the
Jun expiration gets closer but if volatility
decreases or there is a significant change I may
not make the 4.2% per month return.
The whole idea of course is
to take advantage of the volatility of the
market. Three weeks ago this would not have been
an advantageous trade. I am holding my Jun 23
to see if we get a bounce going into memorial
weekend (which historically has a bounce both
into it and a few days out of it). On a bounce I
then check the premiums to see if I should roll
the put – if the return is advantageous.
Remember that the plan is
to someday end up with the stock, but I would
prefer to keep earning money from the puts until
that day arrives. Who knows, perhaps I will earn
enough from the income to pay for a lot of the
stock when I take assignment.
May 21 10
20.88
BTC 5 NP May 22 @ 1.08
13.25
(553.25)
(5.02)
430.75
May 21 10
20.66
STO 5 NP Jun 22 @ 1.88
13.25
11013.25
926.75
8.41
1357.50
May 21 10
20.66
STO 5 NP Jul 21 @ 1.77
13.25
10513.25
871.75
8.29
2229.25
May 21 10
20.88
BTC 5 NP Jun 21 @ .96
Comments: See my comments below for May 21 2010 to explain
why I bought to close this position so early.
13.25
(493.25)
(4.69)
1736.00
May 25 10
20.20
Bought 1000 shares @ 20.20
7.00
(20207.00)
May 25 10
20.20
STO 10 NP JUL 17.00 @ 31
19.50
17019.50
290.50
1.70
2026.50
May 27 10
21.50
Sold 1000 shares @ 21.50
7.00
21493.00
1286.00
3312.50
Jun 2 10
21.20
STO 10 NP JUN 19 @ .16
19.50
19019.50
140.50
0.73
3453.00
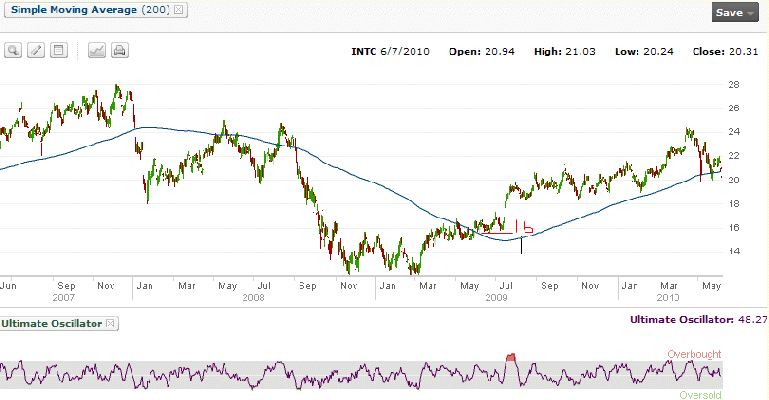
June 7 2010:
Today the stock again fell below
the 200 day moving average for the third time in
less than a month, a sure sign that the selling
will probably intensify. With the sharp May
selloff, June does not look much better. In May
2009 the stock climbed to 16 and was stuck there
for some time. In this pullback I will not be
surprised to see the stock fall to $16 as well.
That will be a good place to be in the stock.
Could it fall lower? It hit $12.00 in Feb-Mar of
2009, so $16 should afford me some room to sell
covered calls if I was assigned. Meanwhile I
will continue to roll my naked puts at this
stage and then put more in place as the stock
declines and volatility increases put premiums.
Jun 7 10
21.00
BTC 5 NP JUL 21 @ 1.05
Comments: I closed this put as it is in a large profit
position having sold it for 1.77 and buying it back for
1.05. This also releases $10500 in capital for naked puts.
13.25
(511.75)
(4.86)
2941.25
Jun 7 10
20.98
BTC 5 NP JUN 22 @ 1.23
COMMENTS: I bought to close this put as I sold it at 1.88
and I wanted to lock in this 34% profit in the event that i
believe Intel will fall below 20 before Jun option expiry.
This releases 11000.00 for more naked puts
13.25
(628.25)
(5.7)
2313.00
Jun 7 10
20.98
BTC 5 NP JUN 23 @ 2.07
13.25
(1048.25)
(9.10)
1264.75
Jun 7 10
20.30
STO 4 NP OCT 22 @ 2.81
Comments: I rolled the JUN 23 to the OCT 22 and sold 2 less
puts for a net credit of $216.00. This frees up $4600 in
capital, plus by moving the 3 to the $22 strike I free up an
additional 3000 for a total of 7600 in free capital. Added
to the Jul 21 buy to close I have a total of 18100.00 now
available for naked puts. As I believe more selling is
coming I will hold off selling more puts to see if Intel
pulls back below $20.00
12.00
8812.00
1112.00
12.61
2376.75
June 18 2010:
It
has been an exciting month for the market and
for stocks like Intel. The volatility increased
in late May and added high premiums for options.
This is where my strategy really shines. I
follow specific companies and over a period of
time, you can get a "feel" for the stock. Intel
at 16.00 would be a great buy, but looking at
the past few months, the chance of intel falling
below 19.00 is not very great. Therefore any
move to $20.00 or lower gives me confidence to
buy some of the stock for a quick bounce, and to
sell out of the money naked puts. Case in point
is May 25 2010, when I bought 1000 shares on the
decline, at $20.20 and sold July $17 puts for
.31 or 1.8%. Imagine owning this stock at 17.00!
In the meantime, the market bounced around and
Intel jumped back up to 21.50 just 2 days later,
allowing for a quick profit of $1286.00 or 6%
for two days work. I find making decisions such
as these are next to impossible unless I am in a
handful of stocks and have watched them for
years.
On the day of the "flash crash", the stock hit
$19.90, so I knew the chance of the stock
retesting that low was a very good. I waited and
sure enough within two weeks the stock was
testing those lows and I bought my shares. If
the stock had not recovered but instead moved
into a new trading range, I would have turned to
covered calls, because at $20.20, the stock was
a very good buy. Just to mention it again, I
believe an investor has to pick a handful of
quality companies, that pay dividends, study
them, set in place a plan, test it and over time
implement that plan. The only change comes when
the stock or the company changes. Then it is
time to re-evaluate and decide on a course of
action including possibly leaving the stock for
another better performing stock..
Jun 18 10
21.40
Expiry: 10 Naked Puts Jun 19 expired
See my comments below for Jun 18 2010
Jun 22 10
20.90
STO 5 NP JUL 20 @ .38
Comments: Following my strategy as detailed out in Jun 18
below, I sold the $20 strike naked puts as I think at 20 or
below would be good strike and if caught in the money I am
confident I can roll the 20 strike for some time.
13.25
10013.25
176.75
1.76
2553.50
Jun 23 10
20.32
STO 5 NP AUG 17 @ .30
13.25
8513.25
136.75
1.60
2690.25
Jul 1 10
19.10
STO 5 NP AUG 17 @ .33
Comments: With the downturn in stocks I think Intel will
have a hard time falling much below 19.00. I have 10 Jul 17
Naked Puts that will expire is about 2 weeks. Baring a
disaster, I am sure they will expire worthless. Meanwhile
though, I had to sell in May for Jul 17 in order to get .31
on the puts, whereas right now I can sell the next month out
for the same amount, thereby setting myself up for an extra
month of income from selling naked puts just 1 month out
rather than 2. As well by adding 5 naked puts at the same
strike in August, I am actually reducing the total amount of
capital I will have exposed to Intel, after the July options
expiry.
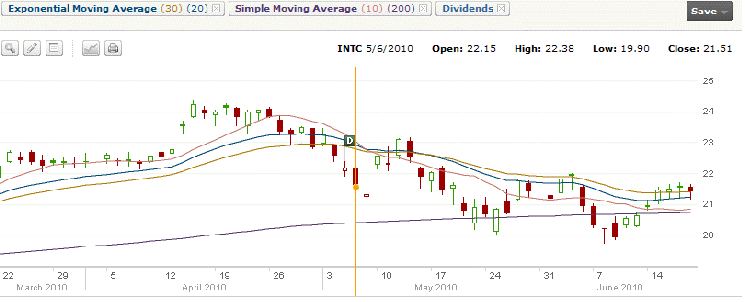
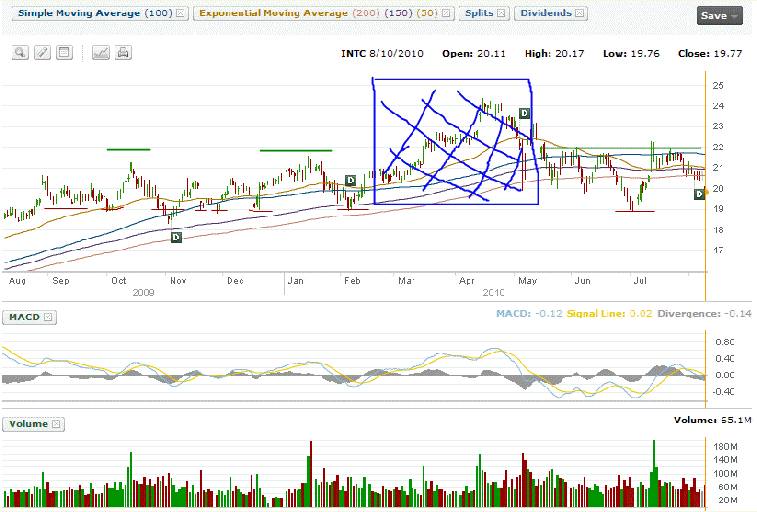
Looking at the
chart, the 19 strike is a good price point to consider for
naked puts. If I take out the rising trend in the stock
(which occurred from the March 2010 to the May 2010 period
which I have done in a blue box), it is easy to see that if
Intel stays in a trend, the best premiums for writing naked
options could stay at the 19.00 strike for the put side and
if I was interested in selling naked calls I could consider
selling the 23 strike on any rise. Right now however I will
be staying with just selling naked puts as earnings have
been strong for Intel and I have never sold naked calls on
tech stocks before. My strategy for Intel has always been
naked puts. I have always found it important to stay with a
strategy that I have confidence in. Selling naked calls on
Intel is not part of my strategy, but looking at the chart I
can see the potential. Presently I am still holding 4
October 22 naked puts and I will roll those as I approach
October unless they end up in the money. With the present
market outlook, I would expect this stock to stay in a trend
with support somewhere around 19.00 and resistance perhaps
at 22.00
Here is what went on
today:
(Reuters) - Shares
of Intel Corp and Advanced Micro Devices Inc
fell on Tuesday after analysts downgraded shares
of the world's top chip maker, warning of a
weakening outlook for corporate and consumer IT
spending globally. Robert W. Baird and Barclays
said they expected a subdued third quarter for
Intel , even though Intel and competitor
Advanced Micro Devices Inc said last
month they expected a strong three months.
Government austerity measures in Europe are
causing cautious companies to rein in PC outlays
in anticipation of a slowdown in consumer
spending, analysts said. Gartner on Tuesday said
it expects worldwide enterprise IT spending to
grow by 2.9 percent this year, down from the 4.1
percent the research company had earlier
forecast.
"What we're seeing
now is more of a cyclical correction, but we see
some very good growth trends for PCs in the next
few years," Baird analyst Tristan Guerra said.
Intel controls about 70 percent of the processor
market and derives about 90 percent of its
revenue from the PC market. Its shares fell 3.4
percent, while AMD's dropped 7 percent. Barclays
downgraded Intel and AMD to "equal-weight" from
"overweight," saying its Asian industry checks
found that broader PC trends for the third
quarter have continued to remain subdued, and
seasonal sales guidance "may prove bold." AMD
and Intel's seasonal third-quarter guidance of 7
percent to 8 percent sequential sales growth
could prove elusive, Barclays said. It said PC
shipments may be up in a range closer to 5
percent to 7 percent versus the normal 15
percent-plus range, reflecting more subdued
demand from Europe, a slowing China, and
cautious U.S. consumers, as well as rigorous
inventory management following overzealous
ordering in the first half of 2010.
Aug 10 10
19.90
STO 5 NP Sep 19 @ .42
13.25
9513.25
196.75
2.0
3359.00
Aug 20 10
18.90
Expiry: BTC 7 NP AUG 20 @ 1.10
15.75
(785.75)
(5.60)
2573.25
AUG 20 10
18.90
Expiry: STO 6 NP OCT 20 @ 1.57
14.50
12014.50
927.50
7.71
3500.75
AUG 31 10
16.75
Bought 1000 shares @ 17.77
Comments: I am buying at this point just for a quick trade
as I believe at 17.77 this stock is undervalued.
7.00
(17777.00)
(17777.00)
Sep 3 10
18.25
Sold 1000 shares @ 18.41
7.00
18403.00
0.00
626.00
4126.75
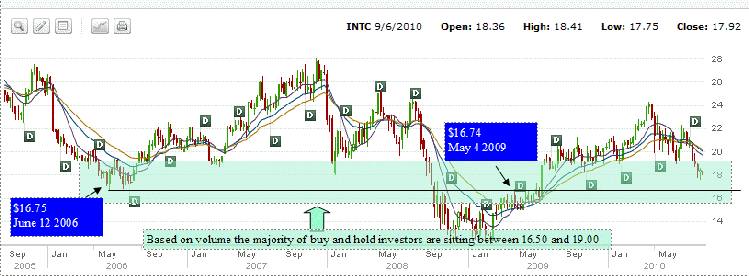
Sep 10 2010:
I have received many
emails from worried investors regarding Intel.
First I would like to point out that the chance
of Intel cutting its dividend is I think, nil.
Next, where is Intel headed? To get a better
picture I have gone back to the five year chart.
The average 5 year lows were $16.75 and
following the crash in 08-09 the stock quickly
recovered to 16.75 again. This marks an
important support. Based on volume, the majority
of buy and hold investors are sitting between
16.50 and 19.00. In 08-09 when the market
crashed, Intel was scooped up when it hit lows
of 12.05 and 12.07. Intel is back under pressure
and looking at the chart, it is now sitting
within support zones. If it falls below 17.00 I
believe it could quickly fall below the 16.75
level and probably trade around 15.50 to 16.50.
At those levels Intel would make for some
interesting naked put selling as that would open
up the $14 and $13 put strikes for selling with
what could be good premiums.
Meanwhile with my goal of
continuing to bring income in and eventually
accept shares, I rolled my October puts today.
Here is what I did and why.
1) My OCT 22 puts are now
deep in the money. I originally sold them for
2.81. Remember this was originally 5 June 23 put
contracts and I reduced them to 4 Oct 22 put
contracts for a small credit. Now that they are
deep in the money, it will be difficult to roll
them with a credit and reduce the number of
contracts. However as I have puts at other
levels I can use them to reduce my number of
contracts and still end up with a small credit.
I rolled the 4 contracts
Oct 22 puts to 3 contracts Apr 22 puts which
created a loss of $262.75. That loss then has to
be made up somewhere. Meanwhile though, this
frees up $2200.00 in capital for more naked
puts.
2) My OCT 20 puts are now
also in the money. Again, this was originally 7
naked puts Aug 20 which I rolled to 6 contracts
for Oct 20. Now I have rolled this to 5
contracts APR 20 for a gain of $232.25. This
frees up 2000 of capital (1 contract was reduced
in the roll from Oct to April) for more naked
puts.
This means the total loss
by these two rolls was $30.50. To make this up
AND reduce my share valuation in Intel I sold 3
Naked Puts JAN 15 at .44 which in the end gave
me a profit of 90.75 on the roll and places my
share valuation at 19.18 (without taking into
account the income made to this point). This
places my position right in line with the Sept
19 puts I am still holding. As Sept options
expiry advances I will probably roll to Jan 19
for a small credit and reduce the number of
contracts by 1.
Following all of this I
have moved my positions back to within the upper
range of where the majority of shareholders are
and continued to earn income from my puts.
Perhaps by the end of next year (2011) I will
have earned an additional 4000 in income. I hope
by the time 3 or 4 years passes I will have made
enough to own the shares without using my
original capital.
Sep 10 10
17.96
BTC 4 NP OCT 22 @ 4.05
12.00
8812
(1632.00)
(18.52)
2494.75
Sep 10 10
17.96
READ MY COMMENTS BELOW UNDER SEPTEMBER
10 2010
STO 3 NP APR 22 @ 4.60
COMMENTS: This is a roll of 4 contracts from Oct 22 to 3
Contracts Apr 22. This reduces my exposure in Intel and
frees up 2200.00 in capital to sell more puts.
10.75
6610.75
1369.25
20.71
3864.00
Sep 10 10
17.96
BTC 6 NP OCT 20 @ 2.15
14.50
(1304.50)
(10.85)
2559.50
Sep 10 10
17.96
STO 5 NP APR 20 @ 3.10
COMMENTS: This is a roll of 6 contracts from Oct 20 to 5 Apr
20. Again it reduces my exposure in Intel and frees up 2000
in capital to sell more puts.
13.25
10013.25
1536.75
15.34
4096.25
THESE TWO ROLLS (Oct 22 and Oct 20 to
April) LEAVE A LOSS OF $30.50. That loss has to be made up.
Meanwhile though I have freed up 4200.00 in capital for more
naked puts.
Sep 10 10
17.96
STO 3 NP JAN 15 @ .44
COMMENTS: This makes up the 30.50 loss and places my average
share valuation at 19.18. See my comments below under Sept
10 2010.
10.75
4510.75
121.25
2.68
4217.50
Sep 17 10
18.89
Expiry: BTC 5 NP Sep 19 @ .15
13.25
(88.25)
(0.92)
4129.25
Sep 17 10
18.70
Expiry: STO 2 NP Oct 19 @ .71
9.50
3809.50
132.50
3.47
4261.75
Oct 4 10
18.80
STO 5 NP NOV 18 @ .49
13.25
9013.25
231.75
2.57
4493.50
Oct 15 10
19.32
Expiry: 2 NP OCT 19 expired
Nov 5 2010: With the rise in Intel shares I
have closed my Nov 18 puts and my Jan 15 puts.
There is little point in keeping the funds held
in reserve however at this level I am not
convinced Intel has room to move a lot higher. I
feel it is prudent to wait and see if there is a
pullback which I can take advantage of to sell
naked puts at strikes below 20.
Nov 5 10
21.19
BTC 5 NP NOV 18 @ .02
13.25
(23.25)
(0.25)
4470.25
Nov 5 10
21.19
BTC 3 NP JAN 15 @ .05
10.75
(35.75)
(0.79)
4434.50
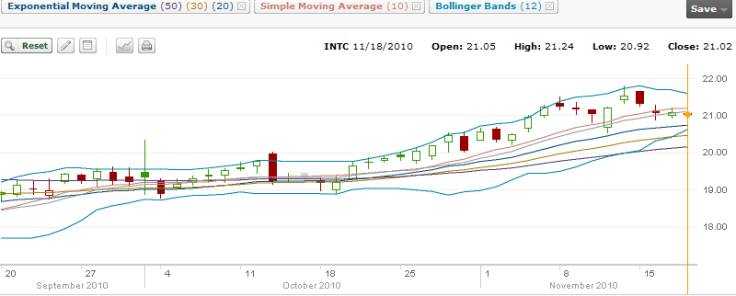
Nov
10 2010: This is why a
plan is important and having historical charts
to follow assist. Looking back to the beginning
of this trade, the stock had recovered from the
lows of the crash and were trading between 19 to
21. Then as in the past the stock moved higher
reaching to the 24.00 level by April. Then
recently a grind lower to the $18.00 level. Now
the stock is turning back up. This is what we
need to keep option premiums high enough to make
trading put options worthwhile. Because I
already know the history of the movements of
this stock, when it rises or falls I am already
prepared and can reduce my positions and roll
them out and sell lower. Basically I am follow
the stock up and down but staying far enough
ahead to make it easy to not get assigned and
keep bringing in more premium. The return this
year will easily be above 15%.
Nov 19 10
20.90
STO 4 NP JAN 19 @ .24
Comments: I am continuing to stay below 20.00 as I think any
weakness and there is a good chance this stock could fall
back below 20.00