|
 |
 |
 |
 |
 |
 |
 |
 |
 |
Capital
Committed |
|
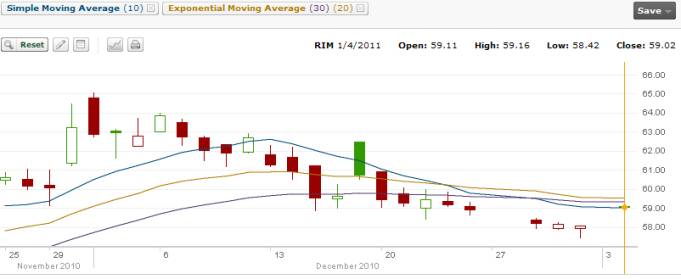
Jan 4 2011: The
10 day has definitely flattened out and today's action is
turning the 10 day. While not maybe up, it is definitely
keeping it flat. I closed my Jan 64 Naked calls today. I
will wait another day to see what develops before selling
naked puts.
 |
| Jan 4 11 |
59.00 |
BTC 5 Naked Calls Jan 64 @ .29 |
(0.45%) |
|
|
13.25 |
|
(158.25) |
21,445.50 |
0.00 |
|
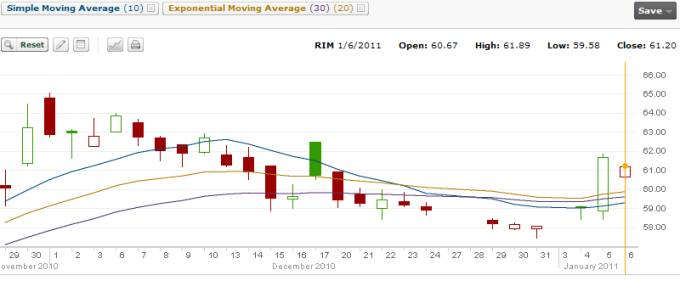
Jan 6 2011: The
10 day is definitely swinging up and it would appear to only
be a matter of a couple more sessions for the trend to move
back up. Today I sold naked puts.
 |
| Jan 6 11 |
60.00 |
STO 5 Naked Puts Jan 60 @ 1.11 |
1.8% |
|
|
13.25 |
|
541.75 |
21987.25 |
30,000.00 |
|
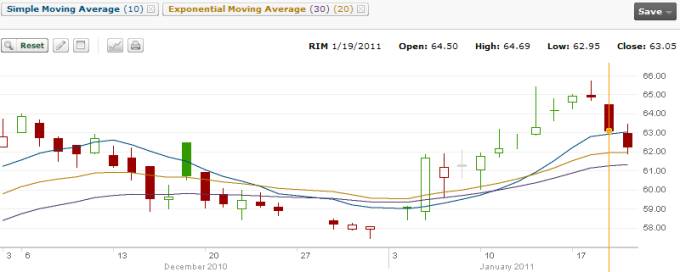
Jan 20 2011: I
have included the image below showing yesterday's action and
today's action. Yesterday RIM took a good fall. The 20 day
was showing a downturn by the noon hour and I tried to close
my puts. I could only get 2 filled. Today I got 3 more
filled to close the trade. Yesterday I sold naked calls
again because the 10 day shows the stock is turning.
Tomorrow is Friday and options expire, so why would I close
just a day or two early? Simply because I am staying
strictly to the 10-20-30 strategy. That strategy showed me
yesterday that the stock was turning. It could easily end up
at or below $60.00. However for .10 cents why not close
early and then apply my capital to the naked call side of
this strategy?
 |
| Jan 19 11 |
64.00 |
STO 5 Naked Calls Feb 66 @ 1.20 |
1.8% |
|
|
13.25 |
|
586.75 |
22574.00 |
63,000.00 |
| Jan 19 11 |
64.82 |
BTC 5 Naked Puts Jan 60 @ .10 |
|
|
|
9.50 |
|
(27.00) |
22547.00 |
51,000.00 |
| Jan 20 11 |
62.30 |
BTC 3 Naked Puts Jan 60 @ .10 |
|
|
|
10.75 |
|
(40.75) |
22506.25 |
33,000.00 |
|
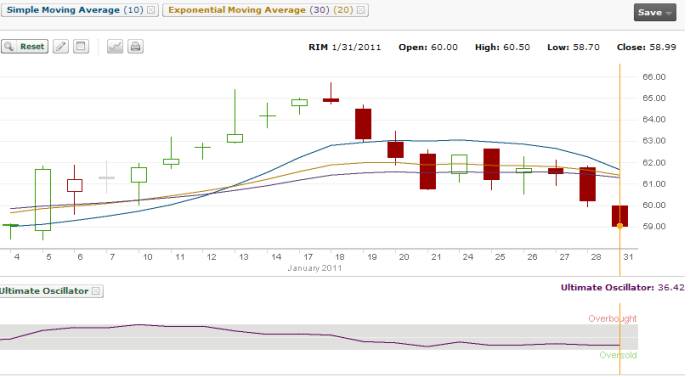
OSCILLATOR ADDED
TO 10-20-30 MOVING AVERAGES STRATEGY
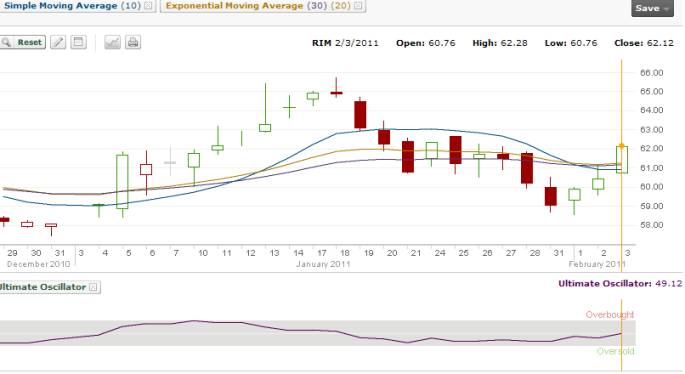
Jan 31 2011: I
have now added the
Oscillator to my arsenal of tools for the
10-20-30 moving averages strategy to see if it will assist
me in my timing of selling naked calls and puts.
I am using
the OSCILLATOR to look for overbought and oversold
conditions. When the stock is oversold I will look for a
bounce. When overbought I will look for a sell off.
On Jan 31
(today) I see that the oscillator shows oversold and the
stock fell from 60.50 to 58.70. The 10 day is falling
rapidly down and the signal of oversold could tell me that a
bounce is going to occur in the next day or two. I closed my
naked calls today based on the
oscillator and the 10-20-30
signal.
 |
| Jan 31 11 |
$59.00 |
BTC 5 Naked Calls Feb $66 @ .24 |
(0.36%) |
|
|
13.25 |
|
(133.25) |
22,373.00 |
0.00 |
|
Feb 3 2011: The
Oscillator was correct and the stock is trending up. Nice to
have closed early and locked in my profit. I could have sold
naked puts yesterday but I wanted to wait for this morning's
action first. Today I sold naked puts.
 |
| Feb 3 11 |
61.80 |
STO 5 Naked Puts March $60 @ 1.90 |
3.1% |
|
|
13.25 |
|
936.75 |
23,309.75 |
30,000.00 |
|
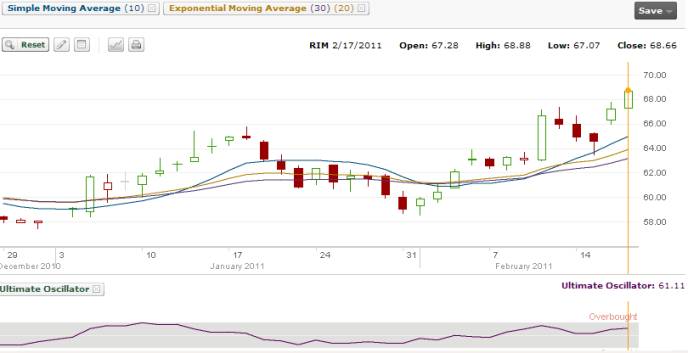
Feb 17 2011: The
Oscillator is showing that we are nearing overbought. The
10-20-30 shows that the uptrend is underway. The stock
though is above $68.00. I sold the naked puts just two weeks
ago. I can close today for .30 cents. For me the secret is
that I believe that Research In Motion is stuck in a trading
range. I want to free up my capital to get ready to sell
naked calls. I closed my naked puts
today.
 |
| Feb 17 11 |
68.25 |
BTC 5 Naked Puts March $60.00 @ .30 |
(0.50) |
|
|
13.25 |
|
(163.75) |
23146.50 |
0.00 |
|
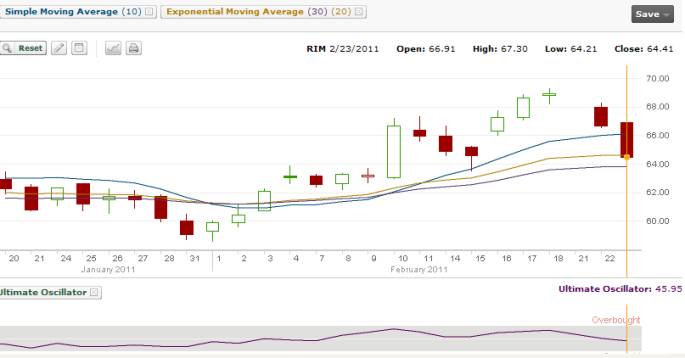
Feb 23 2011: The
oscillator again was correct.
The stock was becoming
overbought and now it is selling off. The 10 day is
flattening out but it is not crossing but instead looks to
be indicating that we could be entering a sideways pattern.
It's tough to call at this stage. I have a large amount of
cash built up. The March 68 call is trading for $1.11 but
the March 70 is at .70 cents. For 1% I will sell the March
70.00 call. I have been in March already so I am basically
adding to my position. The stock has not seen $70.00 for
some time and I do not mind closing this trade early for a
small profit if the trade should turn against me and the
stock
move higher.
 |
| Feb 23 11 |
66.30 |
STO 5 Naked Calls Mar $70 @ .70 |
1% |
|
|
13.25 |
|
336.75 |
23483.25 |
35,000.00 |
|
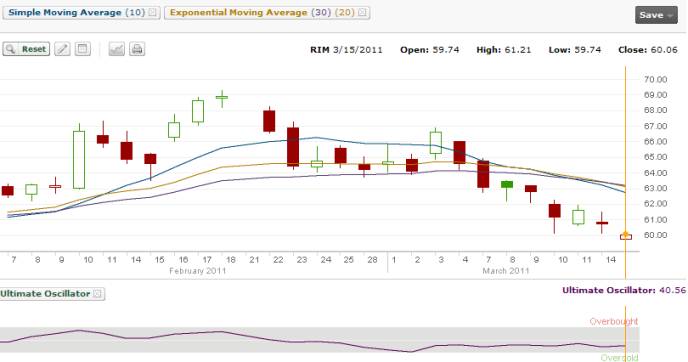
Mar 15 2011:
Nice movement sideways and then down. With just a few days
to expiry, I will watch but I will probably let this trade
expire.
 |
| Mar 18 11 |
$60.00 |
Expiry: 5 Naked Calls Mar 70 expired |
|
|
|
|
|
|
23483.25 |
0.00 |
|
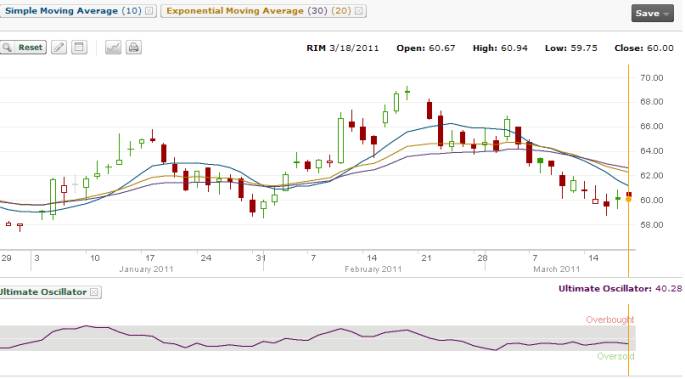
Mar 18 2011: The
oscillator is hanging near the oversold indicator. The trend
is starting to move up although the 10 day is not crossing
the 20 or 30. With neither the oscillator showing anything
and the 10-20-30 not signaling that I should be selling puts
or calls, I have to wait. In order for this trade to follow
the strategy it is important for me to remain consistent.
Right now there is no clear indicator. It could be that the
earnings announcement for next Friday is keeping the
technicals under wraps. I will wait a few more days.
 |
| |
|
NO CAPITAL STILL COMMITTED |
|
|
|
|
|
|
23483.25 |
0.00 |
|
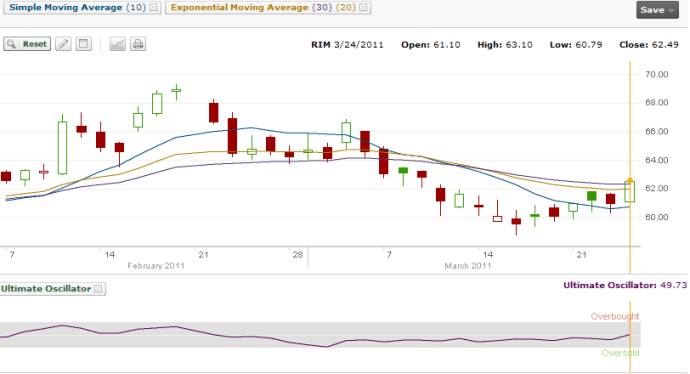
Mar 24 2011:
Today's move was very nice. The oscillator though is not
showing much and the 10-20-30 still is giving me no clear
signal. Tomorrow RIM will announce its earnings and that
should move this stock one way or the other.
 |
| |
|
|
|
|
|
|
|
|
23483.25 |
0.00 |
|
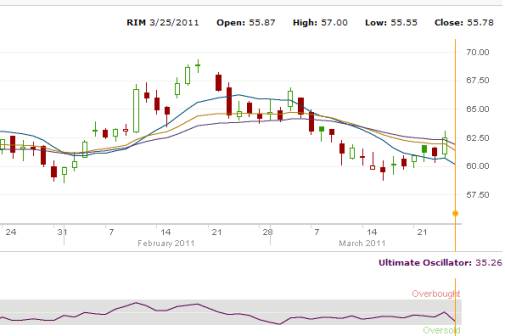
Mar 25 2011:
Rim's
earnings were better than expected but the market
didn't like the forward looking statement as management
warned that earnings will be pressured in the short term as
the company unrolls its Playbook product in which RIM has
spent heavily. Rim tried to convince investors that the
short term pain in earnings will lead to long term gains.
Most investors though are not buying the corporate outlook.
The problem that RIM faces is investors are concerned that
RIM cannot survive the onslaught of competitors like Apple.
Many large investment houses are concerned and on Friday
many analysts lowered their forecasts for RIM. There are
huge short positions on RIM and according to analysts, many
of those short sellers
did not cover on Friday even with the
10% drop. This shows they are confident that this stock is
going lower.
.
RIM remains a
huge player in the wireless communication field. However the
Torch did not turn consumers back to RIM and it is
questionable how well the Playbook will do. As well the
Playbook does not offer RIM the same profit margin as the
blackberry. On the positive side, Rim is selling at only
9.2X earning and today's drop of better than 10% could be
overdone or there could be a small bounce and then a move
lower. The Oscillator shows oversold which is common with so
much selling but in this case might not mean a bottom is in
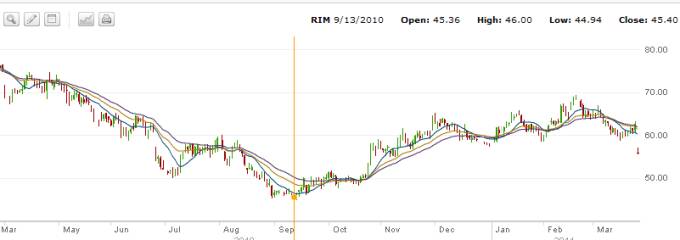
place. The chart below is for 1 year and back in September
2010 this stock was trading just below $45.00.
This trade is
following the 10-20-30 moving averages strategy. If I was
not following the strategy I would have been tempted to sell
the May $50.00 put. However for the 10-20-30 strategy to
work, I have to wait for the proper signal. Today no signal
was given so I have done nothing. It is important to
remember that consistency is the most important part of a
strategy. While emotionally I may want to jump in and sell
the puts, the technicals do not confirm it. To me, the key
to successful investing is following a strategy that has a
proven record. Last year the returns were terrific and this
year so far the 10-203- strategy has paid very good returns.
I will wait for the proper signal to arrive and then make
the trade.
Every day
there are opportunities for selling options. I don't see any
need to rush into RIM without the confirmation of the moving
averages strategy.
I believe RIM
will under perform for some time and until earnings can show
that the playbook is a winner, this is a stock I would not
want to own. I feel sorry for those investors who bought
this stock at $90.00 and higher and continue to hold it
without putting in place proper protection strategies. I
think the 10-20-30 moving averages strategy is proving that
options are a much better way to trade in stocks for profit
and income. Last year the stock fell into the low $40.00. I
believe that over the next few months it could easily be
heading there again.
RIM's market
share is decreasing and it's market cap is following as the
stock drops. This will not be an easy company to turn
around. RIM grew during a period when there were few
competitors. That time has passed and as smart phones become
more widespread the competition will get even fiercer and
profit margins thinner. This is not a stock for the faint of
heart. I will continue with my strategy but if option
premiums begin to evaporate if the stock falls lower, I may
have to end the strategy and find another stock. Volatility
and large price swings are necessary elements to make the
option premiums large enough to risk my capital. Should this
happen, it will then definitely be time for me to say
goodbye to RIM. |
| |
|
|
|
|
|
|
|
|
23483.25 |
0.00 |
|
April 4 2011: Rather
than recovering from the March 25th selloff, RIM has
floundered and continues to drift lower. However technically
there are some interesting developments that tell me my time
to sell some naked puts may soon be arriving. There is no
signal yet from the 10-20-30 moving averages, and in fact
they should more downside to come. However the Oscillator
shows us that the stock is finally flashing oversold. This
could be a short term bounce or even a short term bottom.
After all RIM is making billions of dollars and has no debt.
Momentum is
still negative, but it is not growing but is flat.
.
MACD is still
negative but it is not widening which could be a good sign.
Last is volume which is decreasing, another possible sign of
a short term bottom and a chance to sell naked puts. It may
not be much further ahead before I will be selling naked
puts on RIM.
Let's go out a
year on RIM and see what has been going on. Last August and
September RIM fell into the $45.00 range. I guess we could
say that marks a bottom for the year, but looking at the
chart technically there really is no true support in RIM. If
there is any support it probably rests between the $45 to
$50.00 level, but more likely buyers will step in when the
stocks drifts below $50.00 or $48.00. Resistance is very
easy to spot - definitely at $65.00 which the stock has
pushed up against several times.
Therefore, short
term, selling naked calls at the $60 to $65 level and naked
puts at $50 to $45.00 level are probably the best bets for
me. Today the May $50 naked put is trading at around a $1.00
or 2% and the $60 call around .80 cents or about 1.25%. So
there are still good premiums and lots of reason to keep the
moving averages strategy in play on RIM for the time being.
I will be watching those two strikes and look to sell them
shortly.
|
| |
|
|
|
|
|
|
|
|
23483.25 |
0.00 |
|
Apr
14 2011:
RIM just cannot get a break.
Today's news was that the Wall
Street Journal and New York Times gave less than glowing
reviews of the Playbook citing a lack of email, calendar and
address book. Seems weird that the device wouldn't have
these. Perhaps they will be added before it is released. As
well they also indicated there was a lack of serious apps
for the Playbook. Hopefully Playbook will not equal "Book Of
The Dead". At any rate since the bad news of March 24, the
stock has fallen almost 20%. But yesterday and today (even
with the bad reviews) it seems the technicals may be
pointing to an end to the selling, at least for now. With
momentum, MACD and Volume all showing that buyers have
finally stepped in, perhaps we will see a bounce. Right now
premiums for the puts are poor. The May $46 naked put was
priced .30 bid and .37 ask. Not very convincing for a naked
put sell. I wouldn't touch the $48 at this level.
Here is today's action. (April
14) Rim sold off first thing and kept falling until just
before noon. Even though the selling continued, MACD and
Momentum already indicated that the stock was turning
positive. For those who love to day trade I bet this was a
great play.
The strategy now will be to sell the calls when the stock
turns. Upside I think it might make it to 56. I plan to sell
the 58 naked call should the stock get moving. As of today,
the 58 calls were selling for .50 cents, which again is not
convincing enough to make me put my capital at risk. But
if RIM turns higher then premiums should jump. Upside I think it
could probably recover half of what has been lost or 10%.I
shall wait and see what the next few days brings. |
| Apr 15 11 |
52.90 |
STO 5 Naked Calls 21May11 58 @ .70 |
1.2% |
|
|
13.25 |
|
336.75 |
23820.00 |
29013.25 |
|
APRIL 15 2011: COMMENTS:
The capital
I have made is now at $23,820.00. With 5 naked calls sold at
$58.00 the amount of my own capital being now used has
declined to $5180. This is the goal of selling options. To
earn enough capital that eventually my positions are being
paid for by other people's capital. Kraft is the first stock
that is totally being covered by capital earned from my
trades. RIM is getting very close and should reach that
point sometime this year. |
|
Apr 28 11 |
53.80 |
STO 5 Naked Calls 18Jun11 58 @ 1.45 |
2.5% |
|
|
13.25 |
|
711.75 |
24531.75 |
58026.50 |
| Apr 29 11 |
45.80 |
BTC 5 Naked Calls 21May11 58 @ .03
COMMENT: Today RIMM collapsed as it fell more than 14% on
the news from the company that next quarter earnings will be
lower than originally forecast.
You can read my
assessment of where I think RIM is heading and my strategy
now for RIM here. |
(0.05) |
|
|
13.25 |
|
(28.25) |
24503.50 |
29013.25 |
|
MAY 5 2011:
RIM has really been pummeled. Today the stock finally
started having a bit of a bounce. Look below at today's
chart. You can see that as the bounce got going, more
analysts downgrades came out on RIM. Some estimated the
stock will fall to $35.00. So the mighty analysts who once
loved RIM even as it tumbled have now turned on their once
favored stock. I suppose it's a case of kick them even more
now that they are down or perhaps the analysts are so made
at being so wrong, that they are taking their anger out on
RIM. Who knows and who cares. RIM is still offering great
option premiums so I am staying with naked calls for the
time being. I had the
oscillator open from doing my SPDR SPY HEDGE and I noticed
that the oscillator showed overbought in the morning. I sold
more naked calls here. There is no point in worrying about
even closing the JUNE 58 puts right now. The chance of RIM
running up in this environment is, in my opinion, slim to
none. RIM's stock is so badly damaged it will take months
for the stock to recover. This was an easy trade to make and
an easy decision.
 |
| May 5 11 |
$46.80 |
Sold 5 Naked Calls RIM 18JUN11 $52 @
.92 |
1.79% |
|
|
13.25 |
|
446.75 |
24950.25 |
55,026.50 |
| May 12 11 |
42.10 |
Bought to close 5 Naked Calls 18JUN11
$58 @ .10 |
(0.25) |
|
|
13.25 |
|
(63.25) |
24887.00 |
26013.25 |
|
May 16 2011: The stock held for 5 sessions at support
around the $45.00 strike, but eventually it had to give and
the stock quickly fell to the $41.50 to $42.00 level. This
does not mean that support is broken permanently. There are
a lot of buyers at this level. The stock could see a fall to
about $40.00 or so and then a move back toward the $45.00
strike. Remember RIM is not dead or anywhere near it. This
is still a viable company with a lot to offer its clients. From
here I really believe that RIM has to be undervalued. After
a few sessions I closed my June 52 naked calls. It's obvious
that it's worth closing. It has only been a few trading
sessions since I sold the Jun 52 naked calls. But after all,
they are all the way out to June 18 and the whole concept
with my trade on RIM is to follow the 10-20-30 and
oscillator to decide when to get and out of the trades.
But it also means using common sense. I sold the calls
just a few sessions earlier for .92 so to close them this
quickly at .20 cents is very prudent. With no capital now
committed to RIM, it is a question of seeing if the stock
can bottom here and push back up so I can sell naked calls
again. The Ultimate Oscillator still shows oversold, but by
adding MACD, it is indicating a positive upturn at 0.11. The
ultimate oscillator though, measures buying pressure and
right now it indicates no buying pressure as there are still
lots of sellers.
I believe it is best to close the contracts, lock in my
profit and watch the stock to see if there is a bounce.
|
| May 16 11 |
41.72 |
Bought to close (BTC) 5 naked calls
RIM 18JUN11 $52 @ .20 |
|
|
|
13.25 |
|
(113.25) |
24773.75 |
0.00 |
| Jun 17 11 |
27.24 |
Expiry: JUN $58 puts expired |
|
|
|
|
|
|
|
|