July 28 2011 - Computer Stock Trading -
Embrace It
Before The Open - Possible Bounce Today
But Just A Bounce
I am writing this before the market
opens.
Actually I am writing this at 12:20 AM.
The selloff today took off in the
afternoon and with much of it being computer stock selling , it built upon itself.
As more computers sold more stocks,
eventually most of the S&P 500 and
NASDAQ was being sold which then lead to
even more selling. A billion shares were
traded today and usually 70% are
computers trading stocks..
This evening I read a lot of analysts
who feel this is a great opportunity to
purchase stocks for the next run up.
They see nothing wrong with this
pullback. In fact many see this as just
a sideways consolidation action. They
could be right or they could be wrong.
While technically my charts look poor,
they could easily be right and the
markety march higher. While I may not
have a clue as to the market direction
from here I do know how to profit from
either direction.
On Wednesday,
I sold my SPY Puts around 3:30 PM as I
thought there might be a bounce into the
close, but that was not the case. I sold
though because I want to build up my
cash cushion to cover those times when I
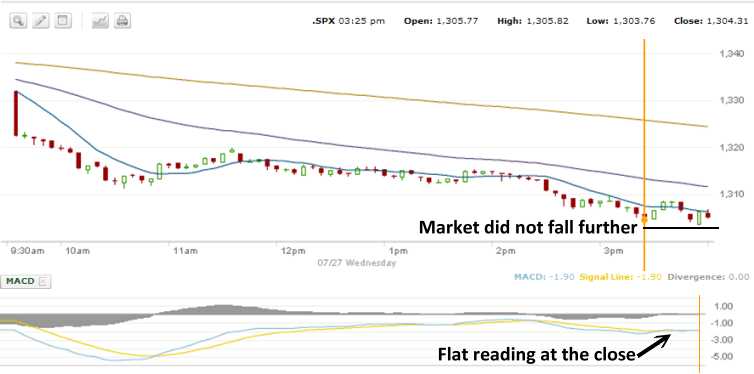
will buy puts and be wrong.Looking at today's action on the S&P 500 you can see
that around the time I sold my SPY Puts, the market
did bounce a little and then closed near the lows of
the day, but NOT lower.
The key to tomorrow though may lie in the MACD. From
3:30 to the close MACD was flat and the Divergence
was 0.00 - indicating no more selling.
It's important to remember that much of the day
to day trading that occurs now on the S&P 500 is
done by computers. For just pennies, these computers
will trade up and down and sideways, generating
millions of dollars in profits. The algorithms used
are top secret but as a small investor I can take
advantage of this by knowing that on big down days
MACD can indicate to me what the computers are
doing.
At the close for half an hour, on the S&P these
computers were no longer selling. That probably
means tomorrow will see buying as these same
computers buy up many of the stocks they dumped
today.
S&P 500 SPY HEDGE STRATEGY REVISITED
This is why I developed
my hedging
strategy years ago when the computers were just
getting started. At that time they accounted for
less than 25% of the stock trades. Today they
account for 70% of all trades on the S&P 500. It is
very important for me to NOT hold onto my SPY puts
for very long. A few days is usually the longest,
but a day or two is the normal holding period.
Computer trading while feared by
many, actually helps to keep volatility up. Long
before the VIX Volatility Index was developed, I
used to manually calculate the market's volatility.
It took quite a bit of work. Often in the 1980's the
volatility would be 12.00 or even 10.00. But as
computers have taken on more and more of the daily
trading, the volatility index has a hard time
falling much below 12.00.
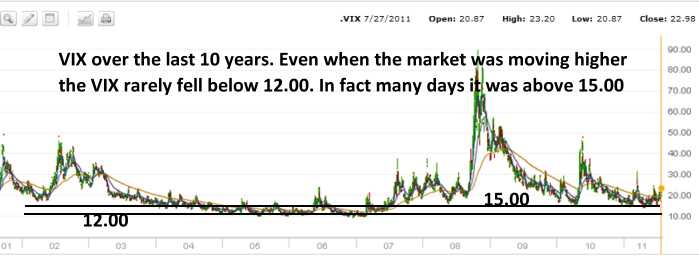
Look at the 10 year VIX chart below.
Look how RARELY the VIX got below $12.00, but how
often it was above $15.00. This was often do to
computer trading which can often push volatility
higher as they "day trade" often for mere pennies.
This chart is of the VIX since 1991.
Look how often from 1991 until 1996 the VIX was
below $15.00. Computer trading did not make up 70%
of daily trades in the 1990's.
Volatility, while difficult for investors to
become accustomed to, actually benefits those of us
who sell options. Today is a good example. On July
25
I sold Pepsi October $60 puts which brought in
.82 cents. The stock was at $64.30 when I sold the
puts. Today when the stock was at $64.40 those same
puts were trading for .90 cents. Volatility had
pushed up the premiums.
When the market pulls back in a big way, it marks
an enormous opportunity for me to sell puts. When
the market bounces I often have a chance to purchase
those puts back and get ready to sell them again.
The same is the case with my SPY Puts which I
have bought as a hedge. It is important to
understand
the strategy being employed. I am building up
cash. But I know that when the market is falling as
it was at 3:30 PM and the VIX was rising
dramatically put premiums are OVER VALUED. The
market maker is selling puts for above average
premiums to take advantage of the rising volatility,
but also to cover themselves in the event that the
market is going to move lower. Market makers rarely
lose money.
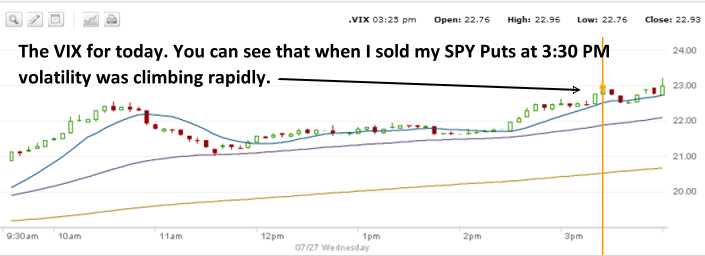
Therefore by keeping the VIX chart open I can
easily tell when the volatility is climbing and
compare it to the S&P 500. At 3:30 PM it was falling
hard and the premiums for my SPY options climbed. I
sold at $4.98 but within milliseconds there were
higher traders than mine yet the index was pulling
back up and the VIX was falling back slightly.
Nonetheless the demand for the SPY puts pushed
prices higher.
By selling my SPY puts when I did I received a great
premium for a very short period of 2 days. The
profit is immediately locked in and I know from
being in the market for many years now, that
computer trading accounts for 70% of any action.
Therefore this evening when I reviewed my charts
MACD showed FLAT. That tells me that tomorrow there
could be buying and that buying could result in
these same computers jumping back in and buying and
selling as they push stocks back up. It's a game,
that's true, but by being aware of what is happening
around me in the market, I can take advantage of the
volatility these computers are creating and sell
options for what is often over valued premiums.
SUMMARY
I hope this article is of value and interest in
showing other investors how to take advantage of the
marketplace we are now in. Remember though that any
bounce is probably just that, a bounce as presently
the trend remains probably lower. For positions
where I have covered calls, on a day like today with
the market falling, I buy them back. Tomorrow if
there is a decent bounce, I would sell them again
and sometimes I move down to the next lower strike
because I have confidence that the market will turn
down lower over the short term and many of my
covered calls will end up out of the money. Remember
there is not fast rule that says you must hold your
option positions until the expiry. Often the better
strategy is to play the volatility swings. For those
investors who find days like today difficult, they
should consider that cash is strategy that is very
under rated especially when computer stock trading
is bound to only increase with each passing year.