Javascript DHTML Drop Down Menu Powered by Drop Down Menu
FullyInformed.com - Options and Stock Strategies For Income

SignUp For Updates 

  You are here:


Bookmark and Share


I hope you find the information, concepts, ideas and strategies on my site of value. If you would like to assist me with the maintenance costs, and time spent keeping my site updated, I have set up a Paypal account for those who would like to donate. Thank you in advance. Remember, nothing on my site is financial advice or recommendations. Investing is risky and losses can be large. Trade at your own risk. Read The Disclaimer


Put Selling
Why Sell Puts
Example Trade- Selling Puts
Tools For Picking Naked Put Strikes
Selling Puts Is Superior To Covered Calls
Understanding The Naked Put
4 Basic Rules For Selling Puts
Selling Puts For Profit & Avoid Assignment
Caterpillar Naked Puts
Put Ladder On Barrick Gold Corp
Rolling Put Options Strategy
Covered Calls
Earn 3% With In The Money Covered Calls
Rolling Covered Calls Down
Staying Positive
Other Strategies
Moving Averages On Cisco Stock
Writing Uncovered Calls
Long Straddle
Miscellaneous
Importance Of A Plan, Goal & Objective
Early Warning Tools
Understanding The VIX Index
The Cautious Bull
Averaging Down In Stocks
"Squeaker" Option Trade On JNJ
Dividend Stocks That Cut Dividends
Hedging Downturns With SPY Puts
Defensive Stock Investing
Moving Averages Trading Strategy
My Strategy Explained
Rescue Strategies for Bank Of America


Trade Anatomy
Charities Are An Industry
Fed Understatement - Defying Logic
A Personal Comment On RIM
Exxon - Patience Is A Strategy
VISA - Risk Against Reward
Microsoft- Reverse Put Ladder
Research In Motion - Not For Investing
Thank You Ben Bernanke
Greek Debt Crisis
Dividend Stocks That Cut Dividends
The Cautious Bull Strategy
Defensive Stock Investing

Spreads VS Selling Puts

Thank You Tax Man
What Next For Research In Motion Stock

Latest Microsoft Stock Report

April Options Results
Comparing The Bear Markets Of 2000 to 2003 and 2007 to 2009
Microsoft Puts Are Better Than Gold
Dance Near The Exit
How I Treat My Investing Like A Business
Microsoft - The Ultimate Utility Stock
The Value Of A Plan
Staying In The Game
It's All About Oil
Market Trend: Still Up - But Watch For June


Sep 16 2010  / Strategy Discussion
Early Warning Tools To Spot A Collapsing Stock

Selling naked puts is a great strategy. They give me so many advantages that I created a page referencing some of my best reasons why I love selling naked puts. Click here to read them

This article is designed to show the tools I use to try to avoid holding or selling naked puts on a stock that is on the verge of collapsing so hard that it leaves me with huge losses. Selling options is a strategy that does not involve making thousands of dollars when selling an option. The strategy is of small profits that over time can create a substantial gain. However selling an option for a small gain only to see a stock collapse, wiping out months of gains is not something I enjoy. Over many years I have found a number of tools that assist me in setting up an early warning that my stock choice might be in trouble. I hope investors find this article of value.


The first thing to remember is my strategy of NOT selling naked puts on stocks that I would not want to own and they must pay a dividend. Often the stocks I buy will fluctuate 10, 15, 20 or even 25%. This rarely concerns me as these are companies paying dividends, I keep cash ready to buy stock on a decline or sell more naked puts and I look forward to the stock's recovery. But sometimes, like in October 2008 stocks can plummet more than 50% and the loss can be staggering, especially if I am holding a naked put I sold for .50 cents and it would now cost $12.00 to buy to close. Can this happen? Absolutely and faster than investors can imagine.


Many traders will explain there are lots of things you can do to protect your naked positions such as selling spreads instead - which in a downturn still locks in a loss. Another strategy is to put in place a stop loss that can assist in downturns but also will lock in a loss in a downturn. I have also found that spreads can lock in a loss during a whipsaw. Whipsaws happen a lot and I am sure most investors have experienced them. I have had stocks plummet 15% and turn around and rise 20%. I hate it when I close a position for a loss only to find out that it was not necessary as the stock recovers.


Other option sellers will tell you that the best thing to do is buy back the option when it has reached 50% or so of the value received at the time of selling. For example, the investor sells an option for 1.00 and he should buy it back if it reaches $1.50. The problem with that however is stocks move around a lot and a naked put can easily reach 1.50 and a few days later be back at .25 cents.


What I really want is some tools that will help me decide BEFORE I sell the naked puts whether or not there is trouble brewing. I want to try to spot trouble with the stock either before I even sell the naked put OR quickly after selling my naked put so I know to close it and get out while the getting is good and any loss is small. I also want to have some comfort knowing that it was the right thing to close early and take a loss or a reduced gain.


Remember there is no fail safe system. I just hope to be right more often than wrong. Let's take a look at some of the tools I use.

Example 1:  Nucor Corporation (NUE)

In July 2008 I received an email from an investor, Gary asking for help.


Here is what happened: On June 24 2008 Gary sold 10 naked puts on Nucor at $75.00 for $2.25 for a total income of $2250.00 before commission. 6 days later the stock closed at $61.94. The cost to close the naked put was 14.80.
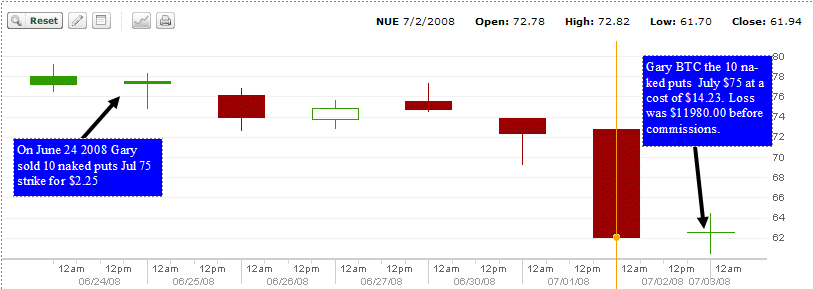


This represented a loss of 557%. That is a staggering loss. When the stock fell on Jul 2, he was shocked and the following day he closed the put and paid 14.23 for a cost of $14230.00. The loss was $11,980.00. (There was no bounce back up just more downward moves) In his email, Gary explained that the loss was still substantially less than if he had bought the stock on Jun 24 and sold it on July 3. He asked me if I knew what he could have done to protect himself from making the same mistake in the future. I told him the best I could do was show him the tools I use and how I use them.


THE TOOLS I USE:


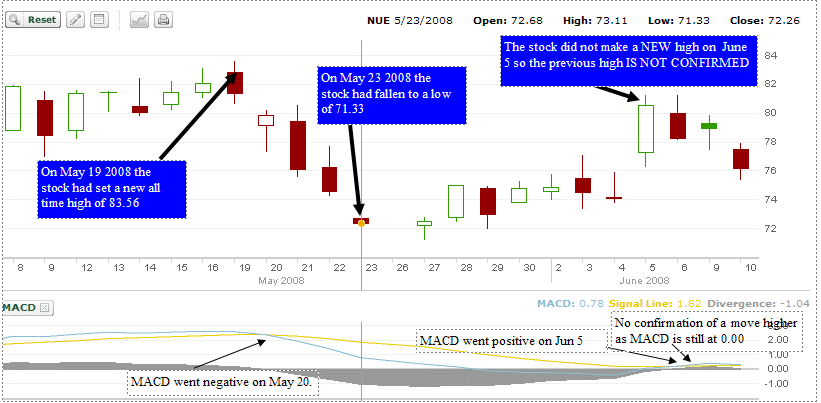
1) I sent Gary a number of images. The image below was from May 8 to June 10 2008. I explained that the stock on May 19 2008 set a new all time high on Nucor and then it fell 14.6% in just 4 days. This makes the new high very suspect that this could be a trap. On May 20 the day AFTER the new high, MACD went negative with a reading below 0.00. A warning that the stock is under pressure. After May 23 the stock bounced higher but MACD did not go positive until June 5. On JUNE 6 the stock fell which then is a warning that the May 19 2008 new high is not confirmed. A new high should be followed by some pullback but the trend should continue higher. However after June 5 MACD did not confirm an uptrend, but sideways and within a day it was neutral at 0.00. All these were warning signs for Gary to hold off selling the naked puts. 


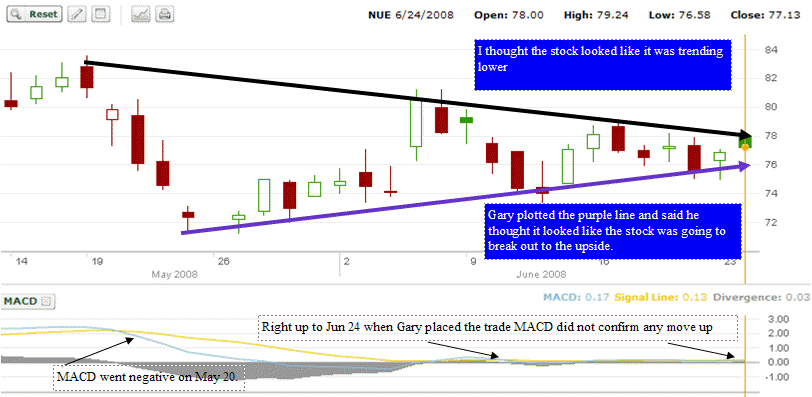
2) Gary had sent me an image showing the purple line below and indicated that he was sure the stock was going to break out. I sent him the image below and showed him I thought the stock seemed in a downtrend. However to confirm either I looked at MACD and it definitely did not confirm any uptrend in progress. This is a definite warning sign. Remember the stock is sitting close to its all time high. The best course of action here is to wait for a clear direction.


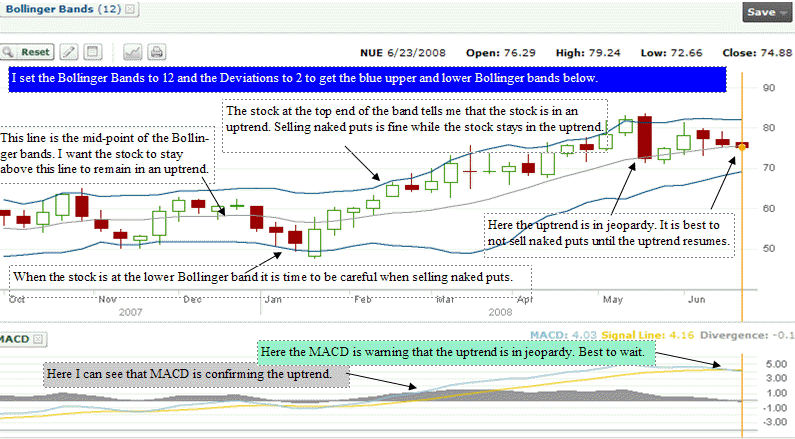
3) I also sent Gary the below image. NUE all the way back to Oct 2007. I set the Bollinger Bands to 12 and the standard deviation to 2. When the stock stays at the upper end of the Bollinger Band the stock is in an uptrend and it is a better time to sell naked puts. However by the time Gary sold his Naked Puts on June 24 2008, the Bollinger Band was warning that the uptrend was in jeopardy which means this is time to hold off on selling naked puts. I have added MACD (Moving Average Convergence Divergence) which shows again that the uptrend was confirmed in February right through to May, but by the time Gary sold the naked puts, the uptrend is no longer confirmed. This is time to be careful. MACD is a momentum indicator that takes two moving averages of prices and shows their relationship to present a buy and sell signal for investors.


The settings I use are, Fast Points of 12 which is for the 12 day EMA and the slow points of 26 which is for the 26 day EMA. The smooth I use is 9 which is the 9 day EMA (mid-point on the Bollinger) which many people refer to as the signal line. So basically I am comparing the movement of the 12 day and 26 day and plotting it against the 9 day EMAs. It's pretty accurate at spotting the changing in trend. It does not predict a change, just confirms the current trend.


4) There are lots more other tools that can be used but I prefer the above tools. An investor could also use the 10-20-30 moving averages. To read that strategy click here.

Example 2:  American International Group (AIG)

So do these tools work on all stocks? Let's look at the worst stock I can remember - AIG. The stock value has been adjusted by the charting software to reflect the horrible consolidation of July 1 2009 of 1 share for every 20 shares held. The loss on AIG for shareholders can only be described by one word - shocking. But the Bollinger Band warned back on July 9 2007 that the stock was in a downtrend. Then in September when the stock moved to the upper Bollinger Band, MACD failed to confirm any move higher. While nothing is perfect, this simple tool told investors to stay away from AIG and as such those of us who sell naked puts should consider a different stock, or consider selling naked calls if that is their interest.


Example 3:  Kraft Foods Inc. (KFT)

Let's look at Kraft. Here is the period from Jul to September 2010. The uptrend is quite evident and confirmed by MACD. As well the only time in the past 3 months to actually worry was during a couple of weeks in August, however the stock did not actually follow along the lower band or ever close on it. This stock is definitely in an uptrend at this time (Sep 16 2010)
 

Example 4:  General Electric Corporation (GE)

Here is GE from Sept 2007 to Nov 2007. You can see that the Bollinger Band warned to get out of the stock by Oct 15 2007 and MACD confirmed it as the trend definitely points down. At that point an investor would close out. The stock then rebounded but MACD failed to confirm any uptrend. By following these two indicators, an investor would have been out of GE in mid October 2007 long before the real damage commenced.

Example 5:  Canadian Imperial Bank Of Commerce (CM)  TSX

For my fellow Canadians here is a good stock to look at: Canadian Imperial Bank Of Commerce. In Sept 2007 the stock marked an all time high of 103.03. That was it for this Bank. It has never recovered as of Mar 18 2011, more than 3 years later. But On Oct 16th the Bollinger and MACD warned about a downturn. When the stock started to recover but failed to make a new high the MACD never confirmed the uptrend but indicated that the downtrend would continue.
 

Example 6:  Manulife Financial (MFC)  TSX

One last stock worth looking at is Manulife Financial. For my fellow Canadian investors, Manulife has been a disaster for more than 3 years. There is just no other word for Manulife for long term investors. But for option traders and day traders it has been a good stock as the volatility and stock price swings have made for good option prices and great returns. Here is Manulife for the months June to September 2010. The stock has moved back into another major downturn. Look at MACD. While recently the stock has twice moved up, MACD does not confirm it as it remains below 0. Not until MACD moves firmly above 0 will the stock be in an uptrend. That doesn't mean the stock cannot be traded or naked puts or naked calls sold, but it is a warning to be careful. This stock could fall further.
 

Summary

There are lots of other tools an investor can use. This is an example of the few tools I use in helping to know when I should be more careful when selling naked puts or naked calls. These tools are not really meant for a strategy of what strikes to select or how far out in time or out of the money to consider when selling naked puts, although I am sure an investor could develop a strategy based around these technicals.

As well I am sure an investor could develop a strategy for buy and selling stocks based on these tools. I do know that these tools have saved me many times from selling naked puts on a stock that I thought was strong, like Nucor, only to find out that the stock was getting ready for a major pullback.
Remember, like all strategies, nothing is foolproof and there are never guarantees that something that worked once will work again. But for me these tools have often provided me with great clues as to when to sell my naked puts or calls and when to walk away.


DISCLAIMER: TRADE AT YOUR OWN RISK. Trading options and stocks can be risky and result in considerable loss. This document is not trading advice. The author(s) assumes no responsibility for errors and omissions and disclaim any and all liability whatsoever. You and you alone are responsible for any investment and trading decisions you make. You understand and  agree there are risks involved in implementing any investment strategies and stock investments. Read my terms of use.


Disclaimer: There are considerable risks involved in all investment strategies. Trade at your own risk.
Stocks, options and investing are risky and can result in considerable losses. None of the strategies, stocks or information discussed or presented are financial advice, trading advice or recommendations. Fullyinformed.com is a private website. Everything presented and discussed are the author's ideas and opinions only.
By using this site, you agree to be bound by its terms of use. The full terms of use can be read here. If you do not agree to the terms of use, do not use this site. The author of fullyinformed.com assumes no liability for topics and ideas discussed, errors and omissions, ads and their content and external links. Any corporate insignia used are registered trademarks of their respective company or corporation and are being used for identification purposes only. All material copyrighted by FullyInformed.com. Reproduction in whole or in part prohibited. Copyright © 2008

 |  site map  |  privacy policy  |  contact me  |  subscribe  |  exchange links  |  the author of fullyinformed  |