Strategy Overview
The Moving
Average Trading Strategy uses moving average cross-over
points on a stock chart to try to pinpoint specific times to
sell Covered Calls, sell Naked Puts, or buy back both
Covered Calls and/or Naked Puts. The objective of this type
of trading strategy is to capture the majority of the value
of the sold option.
Who Might Consider Using This Strategy
A) Long term holders of stocks, to decide when may be the best possible time to sell a covered call with a higher chance of not being exercised.
B) Long term holders of stocks, who have sold a covered calls AND want to determine the best time to buy back the covered call as they DO NOT want their stock exercised.
C) For those who write Naked Puts for income with the hope of NOT being assigned the underlying stock.
Definitions:
Simple Moving Average (SMA) - A simple, or arithmetic, moving average that is calculated by adding the closing price of the security for a number of time periods and then dividing this total by the number of time periods. Short-term averages respond quickly to changes in the price of the underlying, while long-term averages are slow to react. In other words, this is the average stock price over a certain period of time. Keep in mind that equal weighting is given to each daily price. Many traders watch for short-term averages to cross above longer-term averages to signal the beginning of an uptrend. Short-term averages (e.g. 10-period SMA) act as levels of support when the price experiences a pullback. Support levels become stronger and more significant as the number of time periods used in the calculations increases.
Exponential Moving Average (EMA) - A type of moving average that is similar to a simple moving average, except that more weight is given to the latest data. The exponential moving average is also known as "exponentially weighted moving average". This type of moving average reacts faster to recent price changes than a simple moving average. The 12- and 26-day EMAs are the most popular short-term averages, and they are used to create indicators like the moving average convergence divergence (MACD) and the percentage price oscillator (PPO). In general, the 50- and 200-day EMAs are used as signals of long-term trends.
The Theory Of Applying The Strategy:
The strategy is using the 10 day SMA and the 20 and 30 day EMAs. The idea is simply when the 10 day SMA crosses down the 20 and 30 day, the stock is trending down and this would be a peak time to sell a covered call. With the reverse, when the 10 day crosses up and over the 20 and 30 day the stock is moving back up which is a prime time to sell naked puts.
While there is no guarantee with any strategy, there does appear to be some benefit in studying the strategy and applying it on a variety of stocks. As I found through paper trading, it doesn't always work and I have to use it only on stocks that I would own if the trade didn't work out and I was assigned shares. But overall there did seem to be some value to at least putting the strategy in my tool bag of trading strategies to use.
I believe the best way to see the strategy at work is through examples.
Test Stock — Microsoft (MSFT)
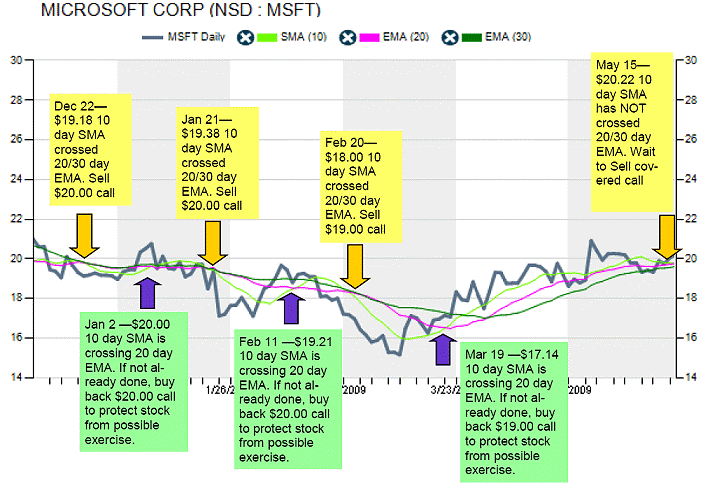
Chart 1 below shows Microsoft over a period from Dec 2008 to May 2009. Studying the chart, I was able to pin point the period to sell calls and when to sell cash secured puts. One of the important things to remember is that when options are sold, they are not always held to expiry, but often bought back to close out the position. The whole concept is to garner as much premium as possible from the sold option and then let time value in the sold option erode as the expiry month approaches. But when the trend changes, buy and close the position early to avoid losing the option premium which will increase rapidly should the stock turn and begin to fall, in the case of a sold put or rise, in the case of sold call. Let's look at this example to explain the concept
of closing the option early to avoid a trend change.
This is a fictitious stock.
Jan 22 - Stock ABC is trading at 25.55 and in an
uptrend according to the moving averages strategy.
Investor sells the Feb 25 put for $1.00. This put
option will expire Feb 17.
Jan 30 - Stock at $25.88 - Put value trading for
$0.85 (The put premium is decreasing as the stock
moves higher AND the expiry of February options
moves closer)
Feb 5 - Stock at $26.10 - Put value trading for
$0.25 (The put premium continues to decrease as the
stock moves higher AND the expiry of February
options moves closer)
Feb 10 - Stock at $25.55 - Put value trading for
$0.55 (The put premium is increasing as the stock
moves lower AND the expiry of February options is
still 1 week away.
You can understand from the example above that
there was a good point when the investor should have
bought back the sold put and earned as much income
as possible. It was around February 5. The exact
same happens with a sold call. It falls in value as
the stock falls but rises in value as the stock
rises. Therefore it is important to keep a watch on
sold options in order to earn as much premium as
possible from them while being aware of the
possibility that the stock trend can change which
often will quickly erode the premiums earned in the
sold option.

You can see from the chart above that the Dec 22 to Jan 21 call resulted in only a small gain. Through paper trading I determined that I was able to increase the odds of the gain being larger if I added two additional rules to the strategy.
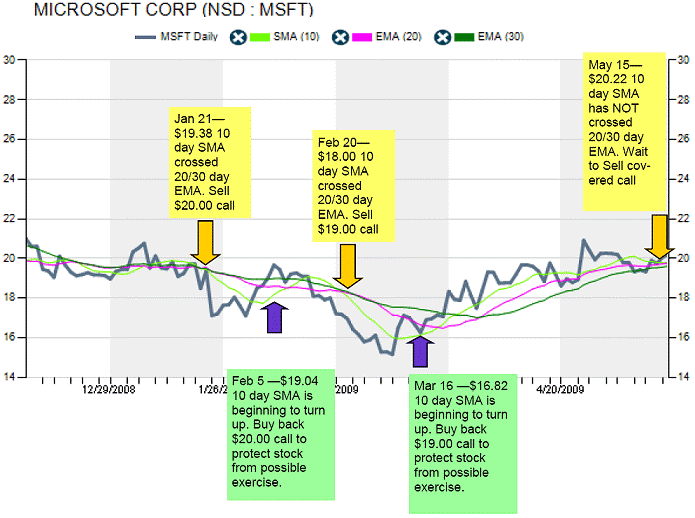
Chart 2 below shows these two changes.
A) Buy back the call earlier, when the 10 SMA FIRST turns UP (as shown in the chart below) being aware that the turn up may just be short term and the trend may continue lower AND/OR
B) Whenever there is a decline in the CALL price to a gain of 75%, buy back the call. In other words if the covered call was sold for .50 cents and it had decline in value by 75% or in this case to .13 cents, then buy the call back. This would protect the stock from exercise and lock in the gain on the call.
The same could be applied to the sold puts.

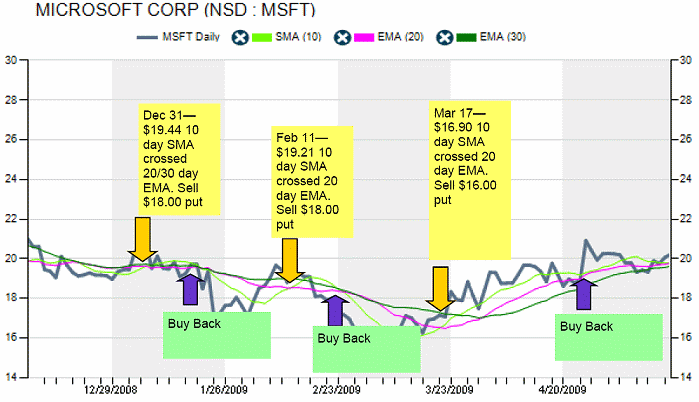
Chart 3 below shows how I reversed the strategy to sell cash secured puts on Microsoft stock without wanting to own shares.
Basically when the 10 day SMA begins to cross the 20 and/or 30 day EMA upwards, then I sold Cash Secured Puts. When the trend moves in reverse I buy back the sold put and close my contracts.

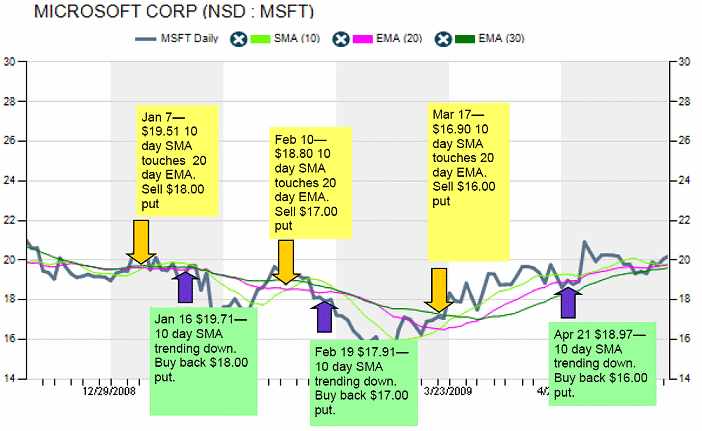
Chart 4 below shows how I can take the same additional rules that I discussed in Chart 2 and apply them to my cash secured puts. Basically buy to close the naked put contracts when I have made a 75% profit or when the 10 day SMA turns down.

Conclusion Based on the above charts and my paper trading, the strategy does have merit. Like all strategies it does not always work and it seems to work better with specific stocks.
To see this strategy in an actual trade, I have been using it for my
Research In Motion (RIM) trade
since 2009. You can review the trades here.
|