YUM STOCK – Stock Selection Process :
This article was originally written on August 11 2009 to explain why I chose YUM Stock for my US Portfolio for selling put contracts against. I am including it again as I have recently updated my YUM Stock analysis as of September 21 2011.
To begin it is important to remember the plan for YUM Stock:
GOAL:
My goal for YUM stock is to collect income from naked put writing.
STRATEGY:
Selling put contracts. If assigned sell covered calls to get exercised out of YUM stock. When YUM stock gets over-valued (in my opinion) I will revert to selling laddered naked puts to keep myself below the stock price to try to avoid being assigned at what I believe to be too high a valuation.
OBJECTIVE:
My objective is not to own shares until I have made enough to pay for 500 shares with the income earned. In other words, other people’s capital earned through selling naked puts on YUM Stock. Should I get assigned I should be able to sell the stock through covered call writing as I plan to sell puts in the lower ranges of the stock. Yum’s chart looks promising for my strategy.
Reflecting on the above plan, here are the reasons that I selected YUM Stock for my US Portfolio.
YUM STOCK – The 5 Reasons
Reason 1: Yum! Brands trend is for more growth.
Yum! Brands controls 5 different concepts. KFC, PIZZA HUT, TACO BELL, LONG JOHN SILVER and A&W. YUM Brands now has 36,000 restaurants in 110 countries and continues to open more outlets every month. Recently I watched a special on TV about Asia and people are lined up outside KFC, Taco Bell and Pizza Hut. In China KFC is incredibly popular. The sales figures show that while YUM is growing slowly in North America, they are growing rapidly in Asia.
Reason 2: YUM! Brands will survive for decades.
McDonalds Restaurants (McDonalds Stock Symbol – MCD) has a market cap of 60.91 Billion (all figures in article are US$). Yum! Brands is now at 15.64 Billion and growing faster than McDonalds. Every year Yum! Brands has increased its market cap. It is now 25% as large as McDonalds. It is definitely a large cap player and will be around for decades to come. While I am not interested in owning YUM stock for any long period, I don’t expect a bankruptcy any time in the near to distant future.
This means if YUM stock falls, I get assigned and/or I have to average down, I can do so with confidence that I don’t have to worry about my investment being wiped out. I can rest comfortably knowing YUM! Brands and my YUM Stock will survive stock market collapses, corrections and the like.
Reason 3: Revenue per share is higher than McDonalds.
Yum’s revenue per share is 23.31 (as of 2009) which is higher than McDonalds. Revenue is now around 10.9 Billion and debt is 3.55 billion, with the majority of this debt being long-term. Quarterly earnings growth is about 35 %. In contrast McDonalds revenue is 22.56 billion with a debt load of 11 billion spread out from short to long-term duration. McDonalds quarterly earnings growth has ranged between negative 3% to 6%. (2008-2009)
Reason 4: Dividend Growth and PE.
Both companies have raised their dividends almost annually which should lead to some support for YUM as its dividend is now over 2%, which is greater than the S&P 500 average of 1.5%. It’s PE is below average.
Reason 5: YUM Stock Chart.
My goal is to earn income through the strategy of selling put contracts against YUM Stock. To do this the stock must meet certain requirements. These should include:
Being in a long-term uptrend is a plus.
Trading in a definable range is a plus.
Having confidence that should YUM stock tumble it will recover is yet another advantage.
Dividend growth means the company is earning more income annually.
Have enough volume both in YUM Stock and YUM Options is a priority.
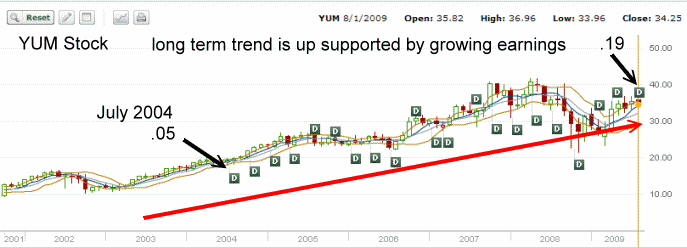
To meet these 5 requirements I need to look at YUM Stock charts. Here is the YUM Stock chart from 2001 to 2009.
A few things are clear in the YUM Stock chart above. The stock is in a definite uptrend. This uptrend in YUM Stock is supported by growing annual earnings. The dividend which started in July 2004 was at .05 cents and is now as of July 2009 at .19 cents. This is a 26% growth over 5 years. Averaged out YUM Stock has grown it’s dividend 5.2% a year. This is terrific growth and will support YUM Stock going forward.
The above YUM Stock chart fills the requirements of numbers 1 and 4.
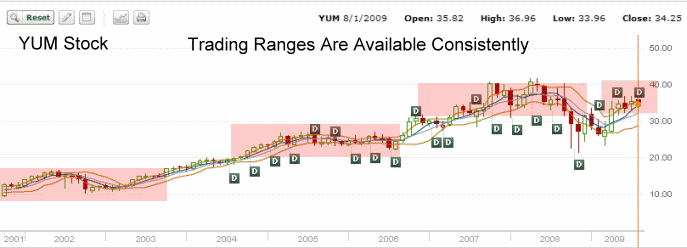
For Requirement number 2, trading in a definable range let’s look at the YUM Stock chart below. I have marked in red the trading ranges that have been available in YUM Stock over the years 2001 to 2009. These trading ranges were consistent which is ideal for selling put contracts against the stock. The consistency is important as it means that I can have confidence in the price strikes selected for two reasons:
1) Should the stock fall lower than the trading range, there is a very high chance of the stock recovering to the trading range.
2) I can select to sell put contracts in YUM Stock just below our just out of the trading range. This means the chance of the stock being assigned is reduced, but should the stock fall and I get assigned before I have the chance to roll YUM Stock put contracts forward or forward and down, I will still be assigned near the lower values in the stock.
Seeing a trading range is important whether or not an investor wants to be assigned shares. A trading range indicates that the stock can probably be bought and sold several times during the course of the year but it also means that I do not end up selling put contracts on the stock at higher valuations than are necessary. Examining the chart such as the YUM Chart below, assists every investor in understanding some of the risk they are taking when selling put contracts. If an investor does not want to be assigned shares and is simply selling the puts to earn income, then a trading range is a priority and selling below that trading range a necessity to help reduce the risk of assignment.
The YUM stock chart below meets the requirements of number 2, trading within a definable range.
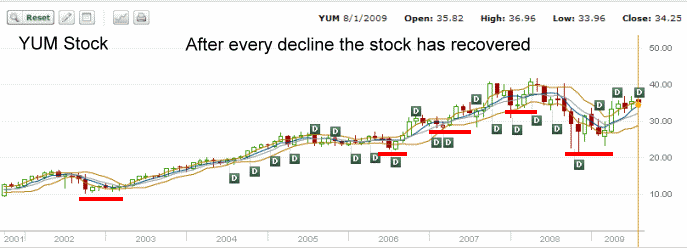
Next up is requirement number 5, having confidence that should YUM stock tumble it will recover. The YUM Stock chart below shows that every decline has been followed by a recovery. This is what my strategy requires. Should I get caught in the downturn and be assigned YUM Stock, I know that the stock has a better than average chance to recover and I will be able to sell covered calls until exercised from the stock. I will then be able to continue with selling puts as long as the stock continues to meet my 5 requirements.
Last is requirement 5, volume in both stock and options. YUM Stock has good volume and the options, while certainly not the largest option volume on the exchange, does have enough volume to make selling put contracts and covered calls more than practical.
YUM Stock – Summary, Why Select YUM
Yum stock more than meets my criteria of being able to support my strategy of selling put contracts. By examining the historic YUM Stock charts I can get a better understanding and a better appreciation of the stock. This is the type of investigation I do for every stock, for while stocks can easily break their ranges and fall lower there are also tools available to aid me in spotting the coming collapse before it happens.
YUM Stock appears to me to be a winner and as such it has entered my US Stock Portfolio as of August 11 2009.
View YUM Stock google chart.
View YUM STOCK trade chart for 2011.


