Regular readers know that YUM Stock is among my favorite group of stocks for Put Selling and the odd stock trade. Put Selling though is my passion and each night I take a moment out and review the stocks on my watch list to see which stocks are ready for Put Selling. But I also have a retirement portfolio where I can only sell covered calls due to Canadian Tax Laws. Many of those covered calls are sold using the Hide and Seek Covered Calls Strategy. That strategy is discussed in this article.
For investors holding YUM Stock as a core holding, earning extra income through a careful covered calls strategy is not only a smart idea but if applied properly it can significantly reduce your YUM Stock cost basis.
At present YUM Stock is facing a lot of headwind having recovered from the most recent sell-off. YUM Stock is exhibiting all the signs of a stock ready to pull back. This might be the prime moment to consider selling covered calls on YUM Stock. Let’s take a look at the YUM Stock chart and technicals to see why covered calls for additional income may make sense here.
YUM Stock Chart Covered Calls Income Trade
This article is not long enough to explain the full workings of the Hide and Seek Covered Calls Strategy. That document is 31 pages in length. But leaving aside some of the strategies involved, if you look at the YUM Stock chart below you can see the recovery in the stock and the recent sideways movement that is beginning to appear.
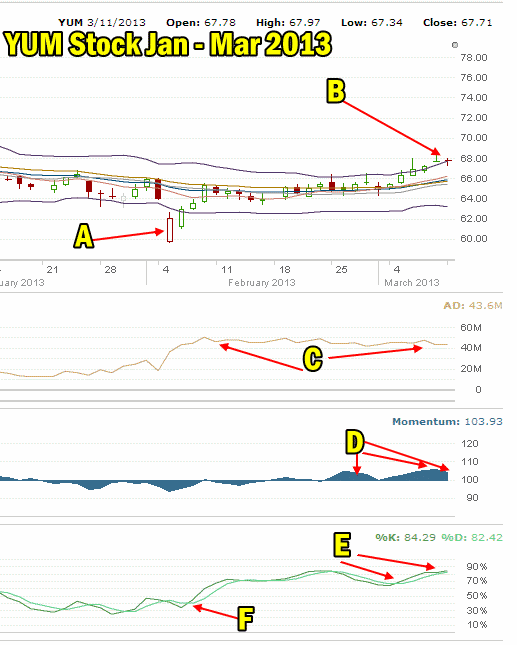
I have marked all the key aspects in the YUM Stock chart below so let’s go over them.
A. The sell-off in YUM Stock on Feb 5 was way overdone as you can immediately see. The stock fell to $59.68 on worries out of China. I sold puts and bought stock on that day. Many analysts who use nothing but Fibonacci to technically examine a stock for support levels, quickly wrote articles indicating the support levels now and where below $59.50 investors should or could consider buying stock. The problem with Fibonacci though is that it is a simple mathematical formula that does not take into account momentum, volumes, stochastic, relative strength, sentiment and much more. This is why I have always found that Fibonacci kept me out of more trades than got me into. I quickly found over years of use that while Fibonacci is okay to use, it is better as a simple guideline. Fibonacci cannot equal the quality of the other technical tools since they take into account a lot more aspects to the underlying stock.
This is why when the stock plunged on Feb 5 I knew from my technical timing tools that I should immediately buy stock and sell puts. There was no way this stock was plunging much lower as far as I was concerned.
B. Now the stock is back trying to break through the $68 level. This is a recovery of almost 13% in the stock in just a little more than a month. YUM Stock is one of those rare stocks that makes Put Selling profitable and enjoyable. YUM Stock now is breaking to the inside of the Upper Bollinger Band. What I look for is for the stock to move sideways. If it still clings to the Upper Bollinger Band even if only creeping higher, I wait before selling covered calls.
C. Accumulation / Distribution is handy to have at a time like this. This chart is showing me that the stock has been bought throughout the recovery. Over the last two days I am starting to see some decline in accumulation. This could be the start of a stalling out for the stock.
D. You can see with Momentum that YUM Stock had a very nice recovery and now has started to see a decline in momentum. YUM Stock can certainly push higher with declining momentum but it cannot hold higher levels without stronger momentum. A decline in momentum is a clue that the stock may be about to stall or pull back.
E. The last indicator is the Slow Stochastic. This indicator looks out beyond one or two days to predict the overall trend. YUM Stock had a very nice buy signal at POINT F on Feb 7 2013, two days after the decline. On that day YUM Stock closed at $63.57. Since then YUM Stock is up 6.9% so even investors could have bought stock on Feb 7 or in my case sold puts and done well. The Slow Stochastic now is signaling there is still some room to the upside but not much. With a reading of K period at 84.29 and D period at 82.42, the upside is still there for the stock (K period is higher than D period),, but D period is very close to K period and often this signals a change in trend to sideways.
The chart below is telling me to watch the stock for a possible shift in trend to sideways with a bias to down. This would be a perfect covered calls signal.

YUM Stock Chart for January to March 2013
One last chart worth looking at is the September to March period.
YUM Stock Daily Chart September to March
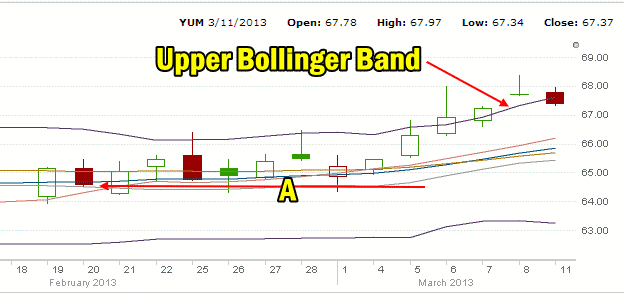
This YUM Stock chart give a better idea as to what to expect. The stock has been in decline since it peaked back on November 29 2012 at $74.47. The latest high was Dec 18 when the stock closed at $69.05. Since then the stock has set up a pattern of lower highs and lower lows which is indicative of a bear pattern. The collapse of the stock on Feb 5 may have marked a temporary or perhaps permanent bottom to the most recent decline and the stock is now pushing the $68 price point. Whether it can continue is easy to establish by following the Upper Bollinger Band.

YUM Stock chart daily from September to March
Upper Bollinger Band Holds Covered Calls Clues
The Upper Bollinger Band should be watched daily to see when YUM Stock pulls away from the Upper Bollinger Band. You can see how today the stock is starting to trend sideways.
Looking at POINT A, you can see how in the recovery period YUM Stock went sideways and several times it still touched the Upper Bollinger Band intraday. These are periods to stay away from selling covered calls, although if you are using the Hide and Seek Covered Calls Strategy, there are other indicators to include that assist in advising you when not to sell covered calls.

The Upper Bollinger Band holds the clue for YUM Stock
Once the Upper Bollinger Band is left behind and the stock pushes sideways, the covered call strike I would consider is the $70. That Yum Stock Covered Call Strike is above the $69 resistance level and as long as you do not sell covered calls against all your stock, you will be left with some shares to help rescue those with covered calls in the event that YUM Stock does move higher and places the $70 covered calls in the money.
YUM Stock and Rescue Strategies
You want to make sure that you always have a rescue strategy in place if you do not want to give up control of your shares. Leaving some shares free of covered calls gives more flexibility to step in and save those shares with covered calls if they are caught in the money. Illustrating that rescue strategy is beyond the scope of this article but suffice to say that you can save an in the money covered calls position by buying back in the money covered calls early and selling more covered calls at a higher price to help defray the cost of having to buy back those caught in the money. I will work on a strategy article for the members section to show this method of rescuing covered calls.
YUM Stock Poised For Covered Calls
Yum stock looks poised for covered calls to be sold and income collected. Just remember that a stock can look perfect for covered calls and then commence another leg higher. That’s the event you want to avoid. I have used the Hide and Seek Covered Calls strategy on YUM Stock many times over the years. You can read a longer strategy write-up at my store. YUM Stock has excellent option premiums and makes both covered calls and Put Selling profitable and enjoyable and that’s what investing is all about.
Yum Stock Internal Links
Yum Stock Members Strategy Articles

