Yum Stock is an all-star when it comes to generating income from Put Selling. That all-star rating is due in no small part to the high volatility within YUM Stock. The 20 day historic volatility in YUM Stock is usually around 26 while competitor McDonalds Stock is normally around 13. Basically YUM Stock has double the volatility of McDonalds Stock and it shows in my earnings between the two companies. YUM Stock has boosted my portfolio each year far more than McDonalds Stock.
Today’s collapse in YUM Stock marks the second big drop in just 3 months. Yet my profits are increasing as YUM stock is collapsing. It’s because I am Put Selling while being aware of support levels in YUM Stock. So while investors worry, I just keep profiting.
Put Selling YUM Stock Against Support
The key though to protecting my positions from being that volatility has been put selling against support levels in YUM Stock. I have mentioned this several times in the past on YUM Stock. The latest article on YUM Stock where I discussed Put Selling against support was Jan 9 2013. Here is a link to that article. In that article I discussed staying away from too high a valuation in YUM Stock and staying at support.
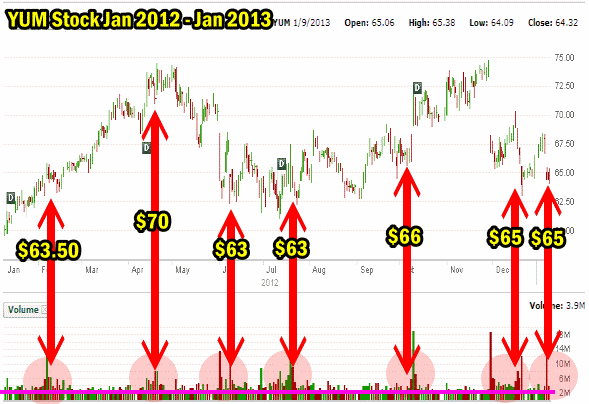
In that article I showed this chart to discuss support levels within the stock throughout 2012.

YUM Stock Support and Resistance
Here is a quote from that article:
YUM Stock is no different. The volume charting above shows where the majority of investors are holding YUM Stock, based on the large volume of shares at that level. With the majority of investors around the $63.00 level, that’s where strong support lies.
Therefore by put selling the $62.50 naked puts, I have a very good chance the puts will expire out of the money. At the same time, should the $63.00 level break for whatever reason, I know I have a good chance YUM Stock will bounce around and I will probably be able to sell covered calls at $62.50 and either work my cost basis in YUM Stock lower, or be exercised out of the stock.
Yum Stock and Put Selling Against Support
When Put Selling against any stock it is always worthwhile looking at the volume indicator and where the majority of trading has occurred. For example if I bring up the daily chart on YUM Stock for the past 6 months I can see that the stock has held tough at $63.00. Therefore Put Selling at $62.50 and $60.00 makes a lot of sense. But the trend in the stock has been lower since the first earnings warning Nov 29 which saw the stock collapse from $74.00. Note how once the collapse commenced the stock kept revisiting the $63.00 level but the highs from each rally have become lower while the lows after each rally kept getting lower. This is typical bear pattern in a stock. Support at some point will break at $63 and yesterday’s earnings warnings was enough to break the $63.00 support level and $60.00.

But in the aftermath later today (Feb 5) the stock has bounced back as it tries to regain support at $63.00. However once broken as decisively as this morning the $63.00 level will be difficult to retake until earnings improve or another catalyst should appear for YUM Stock.
But because I have been Put Selling the $62.50 and $60.00 support levels repeatedly I have no worries. I am sitting below the $63.00 support level. Put Selling below support levels has so many benefits I am surprised more investors do not study charts to look for support in their favorite stocks. This morning’s bounce back allowed me to buy to close some $60 puts and now I can wait and watch to see where the next opportunity lies for some of my $62.50 puts whether it is rolling down, rolling out, picking up shares, selling calls. All the possibilities are there simply because I was selling below the support lines. Understanding support allows me to sleep nights because I know that Put Selling YUM Stock below support will keep my portfolio earning income until the stock recovers.
YUM Stock Internal Links
YUM Stock Members Strategy Articles

