With oil struggling to push below $45 but having trouble holding above $52, the volatility is increasing option premiums within the XOP ETF which I have been trading in since August of 2014. When oil was at $100 I was uncomfortable selling options, but with oil at $50 or lower, I have no concerns selling out of the money options on the XOP ETF.
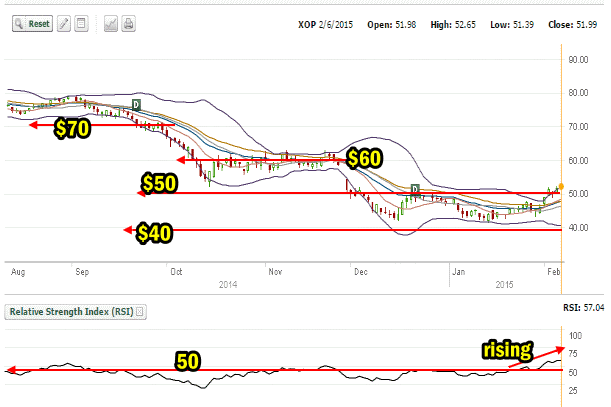
XOP ETF Chart August 2014 to Feb 2015
Looking at the XOP chart since August 2014 below, you can see the decline in oil prices reflected in the fall of the XOP ETF since last August when it was trading above $70 to where it is today. The best support during this period was actually at the $60 valuation. However the strongest support has actually been down around the $42 valuation. Presently you can see that the Relative Strength Index (RSI) technical indicator is back rising, something it has not done for months.
Oil though is a tricky commodity to predict. There are many factors that can affect the price of oil and fortunes have been won and lost trading oil futures. Technical indicators can only provide a limited amount of resource when trading options in the XOP. Catalysts both to the upside and downside cannot be anticipated by technical indicators, which can make trading in these types of commodities, dangerous to capital being used.

Instead, I prefer using the strategies outlined in the XOP ETF trades for 2015 update. This latest update shows also the most recent trade on Friday Feb 6 where I closed one position and had opened another one just two days before. The weekly options have made trading within these types of ETFs, including the XOP and USO, far easier and much more lucrative. Options provides distinct advantages over trading the shares. Options assist in providing flexibility to the trade which is more difficult to establish through share ownership. Weekly options, increase that flexibility ten fold.
The XOP ETF covers a variety of companies through the SPDR ETF S&P Oil and Gas Exploration and Production ETF. It trades on New York under the symbol XOP.
XOP ETF Trades For 2015 Update as of Feb 8 2015
FullyInformed USA Members can review the last XOP ETF trades for 2015 through this link or they can sign in to the full USA members site here. Non-members can join here or read about the benefits of being a member.
Disclaimer: There are risks involved in all investment strategies and investors can and do lose capital. Trade at your own risk. Stocks, options and investing are risky and can result in considerable losses. None of the strategies, stocks or information discussed and presented are financial or trading advice or recommendations. Everything presented and discussed are the author’s own trade ideas and opinions which the author may or may not enter into. The author assumes no liability for topics, ideas, errors, omissions, content and external links and trades done or not done. The author may or may not enter the trades mentioned. Some positions in mentioned stocks may already be held or are being adjusted.
Review XOP ETF Trades For 2015
Review XOP ETF Trades For 2014
Review SPDR S&P Oil and Gas Exploration Background
Internal Stock and Option Trades Links
Put Selling Strategies For Members
Covered Calls Strategies For Members
Profit And Income Strategies Index
Stock and Option Strategies For Members
Stock And Option Trades Explained For Members

