Nucor Stock (NUE) has been in my portfolio since 2010. Annually the returns have always been double-digit and I have never had trouble with the stock or ended up owning a lot of shares through assignment. Just a few days ago on July 7, Nucor Stock made a new 52 week low of $42.24.
Nucor Stock 12 Month Chart
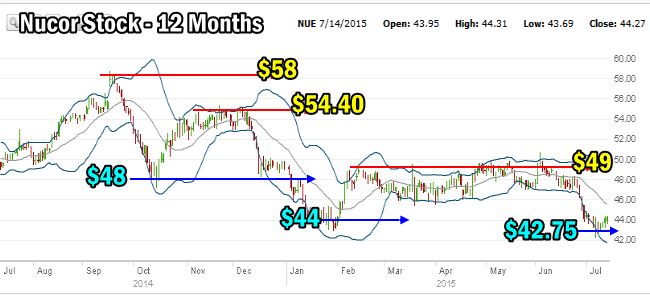
The 12 month chart of Nucor Stock is even more telling. The stock has set up a strong pattern of lower highs and lower lows since reaching above $58 in September of 2014. Since then the stock has been in trouble. Three rally attempts have failed with lower highs being put in place. What is worse is the pattern of lower lows that also developed with the stock moving from a low around $48 last fall to $42.75 this July. These are classic signs of a stock in a downturn and Nucor is showing both of them.
This year the stock has been caught in a very tight range with defined upside and downside valuations. It is obvious investors are concerned about Nucor and its earnings potential.

Nucor Stock – 12 Months to July 14 2015
The chart above warns that investors need to be careful trading this stock. Nucor stock trades on New York under the symbol NUE.
The trade outlined in this article may be better tomorrow or later this week as explained in this article. The rest of this article is for USA Members.
Nucor Stock Trade Alert and Trade Ideas for July 14 2015
FullyInformed USA Members can read the latest Nucor Stock trade alert and trade ideas article directly through this link or they can sign in to the full USA members site here. Non-members can join here.
Nucor Stock Internal Links
Review Nucor Stock Trades For 2014
Review Nucor Stock Trades For 2013
Review Nucor Stock Trades For 2012
Review Nucor Stock Trades For 2011
Review Nucor Stock Trades For 2010
Review all articles about Nucor Stock
Review all Members only articles about Nucor Stock

