Walmart Stock drop this morning after its earnings release shows the value of watching technical timing indicators and using in the money covered calls to profit from a stock position as well as protect it.
Shares of Walmart Stock (Stock symbol WMT) fell over 2.5% today after Wal-mart reported its second quarter earnings. For the second quarter ended July 31, 2012, Wal-mart reported net sales of $113.5 billion. This is a jump of 4.5% over the same period last year. Total revenue for the quarter was $114.3 billion also up 4.5% . Income from continuing operations was $4 billion which is 5.7% increase. Wal-mart is a huge company with a bricks and mortar business that is like a small country on its own. Imagine the complexities of managing and running a retail operation this size. Contemplate the logistics of supplying and moving the myriad of products they carry. Management continues to impress me with their constant focus on improving their business model.
Walmart Stock Was Overbought
But Walmart Stock was also way overbought. I have written numerous articles recently on Walmart Stock including one on using a stop-loss for protection and another on Put Selling the rise in Walmart Stock to earn income and if assigned making sure an investor is not in very high on the stock.
There are lots of other warnings signs an investor can keep an eye out for. The most common warning sign is the increase in the number of analysts who are following the stock. The second is the number of analysts who are telling investors to buy the stock and the third is the “pie-in-the-sky” valuations that appear everywhere in the media. For example, recently Walmart stock was listed as probably reaching $100 by September.
Stock Technical Analysis – Walmart Stock
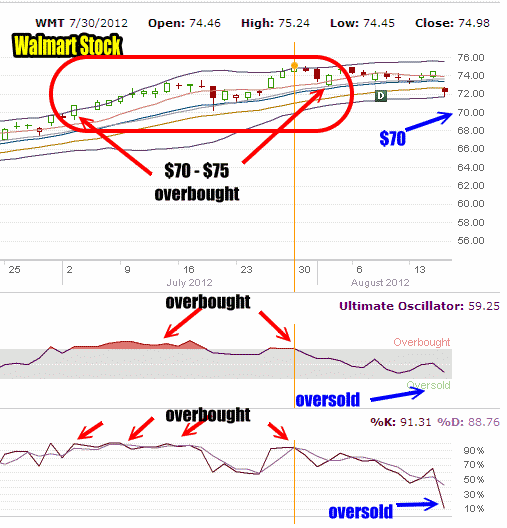
Looking at the stock technical analysis indicators, Walmart Stock has been overbought since early July as Walmart Stock rose above $70.00 to just above $75.00 by early August. This shows how long a stock can stay overbought as investors enthusiasm pushes a stock way beyond normal valuations.
The Ultimate Oscillator and Fast Stochastic show the overbought technical readings. You can also see from the same stock technical analysis that Walmart Stock is now very oversold which is why I sold Walmart Stock puts today.
The put strike I picked for my first set of puts is $70.00. Part of this is based on looking at the rise in the stock and how the selling in the stock which pushed Walmart Stock to extremely oversold did not break the $70.00 valuation. $70.00 is also the starting point for when the stock started becoming overbought. I therefore expect that $70.00 could be the first stop of the decline in Walmart Stock.

Stock technical analysis of Walmart Stock shows how long a stock can stay overbought.
Walmart Stock 10 Year Chart
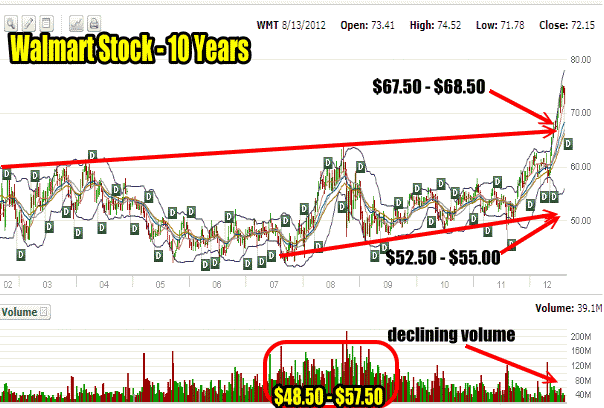
When doing stock technical analysis it is often worthwhile looking back 5 or 10 years. Below is the 10 year chart for Walmart Stock. Look at how this latest rise in Walmart Stock. Going back to 2003 we can draw a technical graph that shows the highs over the 10 year period should show some support between $67.50 to $68.50. Again the $70 put strike is probably a good place to start for Put Selling Walmart Stock.
Meanwhile if a plummet should come in the stock market as we saw in 2002 – 2003 and in 2008 – 2009, there is a good chance Walmart Stock could fall as low as $52.50 to $55.00.
Volume Indicators
Stock technical analysis is never complete without a look back at 10 years of volume. Interestingly look at how much volume there was in Walmart Stock from 2007 to 2009. I have marked this area in a red circle. If a lot of these buyers have not sold then they are holding stock between $48. 50 to $57.50.
Again looking at volume, look at the recent rise in Walmart Stock and as the stock rose, the volume actually declined. This is the sign of a top in a stock and should be heeded. It is also a great sign that in the money covered calls could be considered.
Looking at the volume indicators for 2012, despite analysts pushing Walmart Stock like crazy, volume would indicate that a lot of buyers were sitting out the rise in Walmart Stock so far this year. The only spike in the stock was when it reached above $74.00 and obviously someone was unloading a lot of shares. Let’s hope it was not retail investors who bought the stock above $74, but in all likelihood it was.

The 10 year chart of Walmart Stock provides interesting technical data for stock and option trading
Walmart Stock In The Money Covered Calls
In the money covered calls on Walmart Stock would have been a great trade for long-term investors and investors who bought stock above $72.50 in this latest run-up of Walmart Stock. As the stock rose but volume did not and as the Overbought Technical indicators began to erode with the decline in Walmart Stock, an investor could have sold in the money covered calls to bring in some income and then considered buying them back on a day like today.
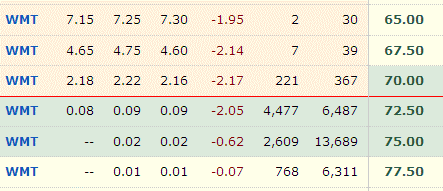
For example, just a week ago, the $72.50 in the money covered calls were trading for over $2.50. Today they could be bought back for .09 and .10 cents.
Below are the covered calls options that expire tomorrow, August 17 2012. Even an investor who sold the $67.50 last week for $7.10 to $7.25 could have bought back those in the money puts today for $4.60 to $4.75.

In The Money Covered Calls Options for August 18 2012 expiry On Walmart Stock
But what is more important about in the money covered calls is that they provide substantial protection as well as profit opportunities if investors are willing to watch the stock technical analysis tools to spot the pullback in the stock.
In the money covered calls on Walmart Stock Conclusion
I wrote this short article to show that there are many different strategies investors who hold stock can consider. When a stock such as Walmart Stock rises far beyond normal valuations, investors need to watch for the warning signs that the stock is about to pullback.
By using those warning signs long-term investors can earn significant profits and still hold onto their long-term stock. By doing this type of in the money covered calls investors benefit by reducing their cost basis in Walmart stock and by having capital returned to them through in the money covered calls, investors can get that returned capital working in other stocks which help to compound capital and grow a portfolio.

