On my yahoo forum which is free for anyone to join one member set up a naked puts trade on Cummins Stock which trades under the symbol CMI yesterday. This trade was done based on a formula devised around the Greeks which tries to estimate what chances there are for the trade to be successful simply by the stock staying above the put strike sold. By selling the put strike at $105, the goal is to earn the put option premium by having the stock stay above the $105 valuation. This morning though the stock collapsed to $100.61 on disappointing earnings.
CMI Stock Trade From Oct 26 2015
Here is the trade the investor set up on October 26. CMI Stock Closed At $112.84 on October 26.
CMI
STO (Nov 6 weekly) 105NP@ .55 (12 days)
90.6% chance stock will remain above strike
6.7% OTM
D= -.09
Stock at 112.55 -.29
Recent low was 105.40 which appears support
Good earnings
The Greeks Estimate
By using the Greeks, the technical stats showed that there was a 90.6% chance the stock would remain above the $105 put strike for the next 12 days. But the Greeks cannot take into account short-term volatility. They look at past movement and price action to predict future movements.
Today however Cummins Inc net income fell to $380 million from $423 million in the third quarter results announced today. Estimates were for earnings of $2.59 per share but instead they came in at $2.14.
The forward guidance was also poor with Cummins announcing 2000 job cuts by the end of the year. Basically revenue out of Brazil and China dropped dramatically and the outlook remains poor for diesel engine demands through 2016.
Volume Defeats Greeks
While the Greeks certainly have their place especially in option trading, stocks that have been in a decline such as Cummins Inc are often better traded by reviewing volume to determine where the strongest support is and then setting up trades around those support points.
This is because in any decline stocks normally follow patterns and when they reach strong support levels where large quantities of shares have traded, they slow their descent and often will bounce back or at least stabilize and not fall further.
To study volume in a stock I use the 5 year chart and look for periods when volume was above average. This advises me where larger quantities of stock has been traded and where often the majority of longer-term investors are sitting with positions.
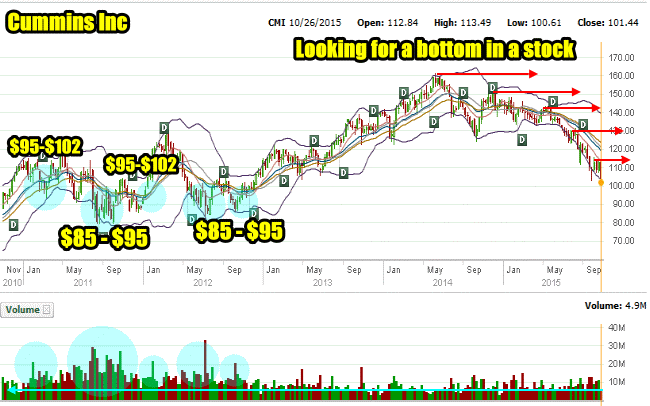
Cummins Inc Stock Chart – 5 Year
To accomplish this I review the average daily trading volume which in CMI Stock is 2.1 million shares. I then draw a dividing line through volume at 2.1 million (light blue line in chart below) and look for above average volume periods (marked in blue circles). You can see there were five very strong periods in 2011 and again in 2012 in the chart below.
During those periods the stock traded large volumes daily within two ranges; $95 to $102 and the $85 to $95 valuations. That tells me that if the stock cannot regain its footing after today’s sell-off the stock could fall back to those levels. A break below the $85 to $95 valuations is almost always brutal for investors as this would result in many long-term investors bailing on the stock.
Rescuing Trades
Volume Is Absolute
Protecting Capital Is More Important Than Profits
Understanding The Risk To Capital When Selling Options For Income
Understanding Volume’s Importance
Learn More To Protect From Losses
Learn more about strategies for income and profits while focusing on protecting your capital by becoming a member. You can review the various benefits of a membership or join through this link. Memberships are $29.16 a month when paid annually.
Internal Stock and Option Trades Links
Put Selling Strategies For Members
Covered Calls Strategies For Members
Profit And Income Strategies Index
Stock and Option Strategies For Members
Stock And Option Trades Explained For Members
Ask A Question About A Trade You Are In
Disclaimer: There are risks involved in all investment strategies and investors can and do lose capital. Trade at your own risk. Stocks, options and investing are risky and can result in considerable losses. None of the strategies, stocks or information discussed and presented are financial or trading advice or recommendations. Everything presented and discussed are the author’s own trade ideas and opinions which the author may or may not enter into. The author assumes no liability for topics, ideas, errors, omissions, content and external links and trades done or not done. The author may or may not enter the trades mentioned. Some positions in mentioned stocks may already be held or are being adjusted.


