Expecting A Bounce
Today’s selling. may have been unwarranted but it shows investor’s nervousness. Even the news of the debt ceiling issue being resolved, even if for just a year or two, did nothing to help the market.
The news that US Consumers pulled back from spending to levels not seen since 2008 hit the market hard. After my write up yesterday where I said goodbye to the bull market I bought a large quantity of SPY Puts at the open. I then sold then at the close.
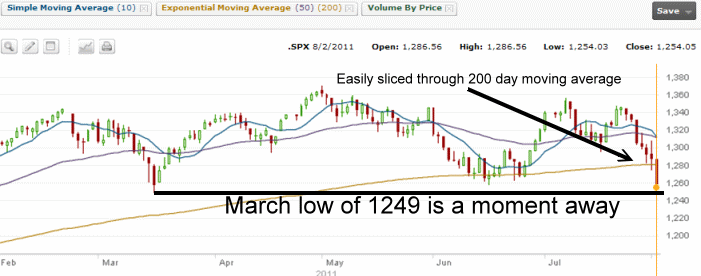
The return for the 1 day trade was 30%. These are the types of returns I see during bear markets, not during bull markets. The drop of 2.56% in the S&P to 1254.05 is a clear indication that the market is in trouble.
Today’s chart of the S&P 500 should how easily the market collapsed through the 200 day moving average. We are now lower than the June lows and just 5 points away from the March low of 1249. The next support is almost 10% away at 1175.00
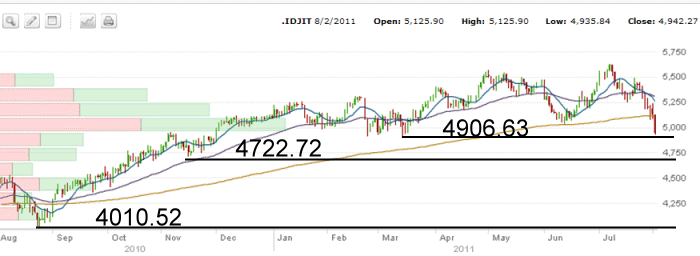
The Down Jones Transport Index is a good bellwether to consider looking at. It indicated SELL a few sessions ago when the index broke the 200 day moving average. Today it fell through the 200 day and is set to break the March low. I have marked on the chart the next two levels for the index to reach. The low of August 2010 could actually be easily reached if the US Economy stalls here. There is no need of a recession for the Index to falter. Just a stalling of the economy would move the index lower.
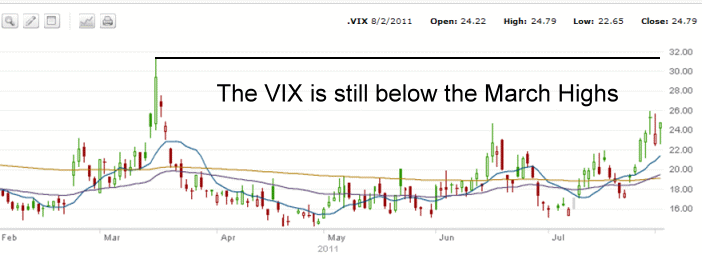
The VIX closed up another 4.78% to 24.79, but it remains below the March Spike.
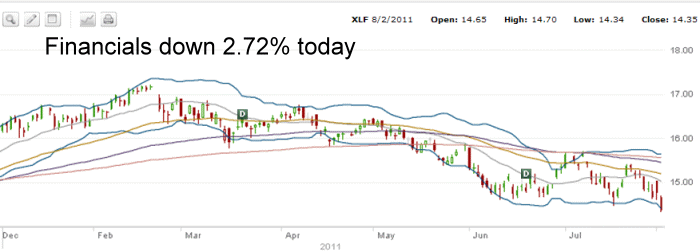
Finally the XLF was down another 2.72% today and closed on the lows. The financials have been in a decline since Feb 2011. This now marks a 6 month decline which is definitely a bear market. This is an index I have commented on quite often as it indicated to me that Stocks were going to pullback sometime by summer. Such has been the case.
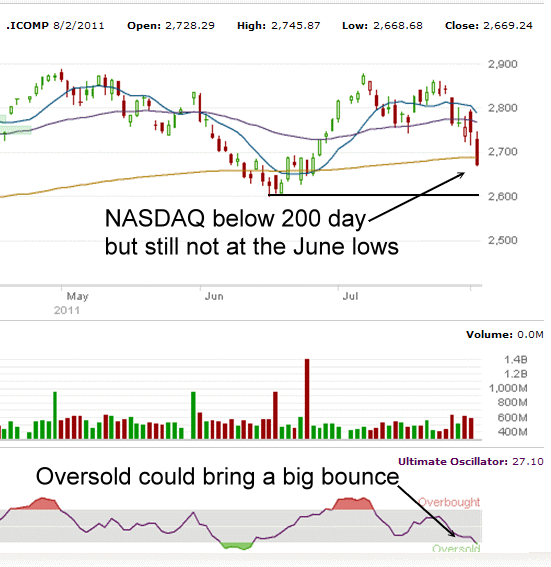
Last chart is the NASDAQ and it holds perhaps the best hope for the markets. Again as I have said so many times in the past, the NASDAQ lead the market from the March 2009 lows. Recently it set a new high and then sold off. Today the index broke through the 200 day moving average BUT the index has now reached the lows of June and like all the indexes the oversold indicators are strong which could lead to a decent bounce.
MARKET CALL SUMMARY – Selling Intensifies
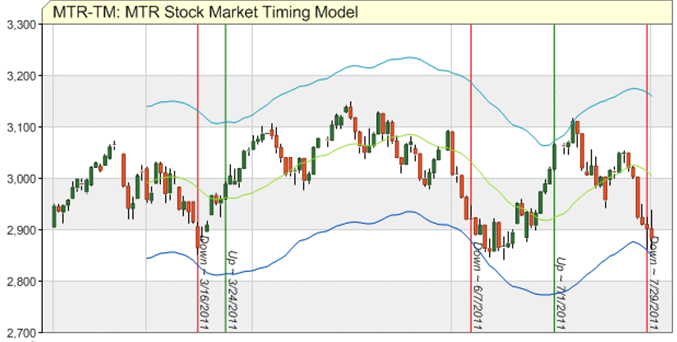
All the indicators are showing market down. For those investors who do not follow technical indicators, I can only say that a market down call was issued by MTRIG.COM a few sessions ago. My friend Patrick who runs mtrig.com developed this excellent timing model. It has been very accurate.
However, the market after today’s heavy selling is now oversold. Look for a market bounce tomorrow or some time this week. It could be large and decent. It is also the opportunity to buy SPY Puts. I would urge readers to review the Hedge Strategy Paper I wrote in 2010. There are three strategies discussed in that report depending on whether or not I have time to be in front of the computer for the trading day.
Today’s selling is just indicative of the nervousness of investors, but it is also a sign of the bear. We could easily rally for a number of days, but in the end, I believe the market direction is down and every rally higher just gives me the opportunities to sell in the money covered calls to reduce my cost per share for stock I am holding, to sell naked calls to bring in income and to purchase SPY Puts to earn income on every pull back.

