Prior Trading Day Summary:
A second more limited bounce was expected for Tuesday. Much of the day was spent negative for the SPX but by the close the SPX and NASDAQ were both higher.
The S&P ended the day up 24 points to close at 5495.
The NASDAQ rose 141 points to end the day at 17,025.
With both indexes higher investors are prepared for the Consumer Price Index report for August due out today at 8:30. This is an important report for the markets as next week the Fed makes the latest interest rate decision.
Let’s review the closing technical indicators from Tue Sep 10 2024 to see what the signals advise for Wed Sep 11 2024.
Stock Market Outlook: SPX Closing Chart For Tue Sep 10 2024
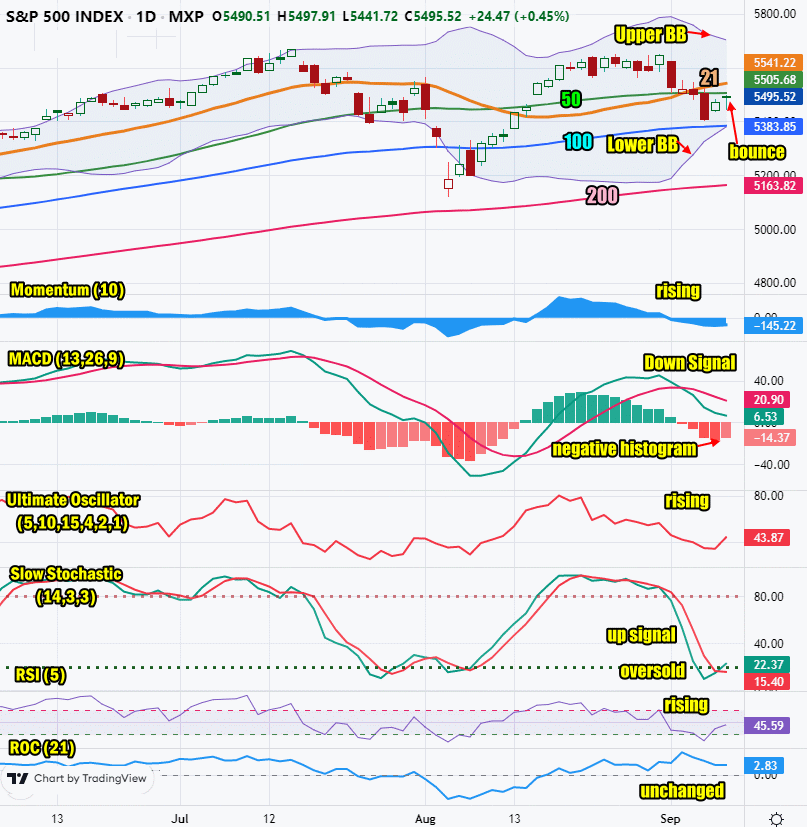
The index closed below the 21 and 50 day moving average and above the 100 day which is bearish.
The closing candlestick is signaling that Tuesday’s move higher was a bounce but not an up signal.
The 21 day moving average is higher at 5541. This is bullish.
The 50 day moving average is higher at 5505. This is bullish.
The 100 day moving average is rising and closed at 5383 which is bullish.
The 200 day moving average is in an uptrend and closed at 5163 which is bullish.
The Lower Bollinger Band is at the 100 day moving average which is bearish.
The Upper Bollinger Band is turned lower. This is bearish.
The S&P chart is split almost equally between bullish and bearish for Wednesday.

SPX Stock Market Outlook review of Tue Sep 10 2024
Stock Market Outlook: Technical Indicators Review
Momentum: Momentum is rising and negative.
|
MACD Histogram: MACD (Moving Averages Convergence / Divergence) issued a down signal on Thu Sep 5 2024. The down signal lost strength on Tuesday which you can readily see in the histogram. .
|
Ultimate Oscillator: The Ultimate Oscillator is rising and negative.
|
Slow Stochastic: The Slow Stochastic has an up signal in place. It is oversold.
|
Relative Strength Index: The RSI signal is rising and negative.
|
Rate of Change: The rate of change signal is unchanged signaling Wednesday may not see much change by the close.
|
Stock Market Outlook: Support and Resistance Levels |
| 5615 is resistance |
| 5600 is resistance |
| 5575 is resistance |
| 5550 is resistance |
| 5540 is resistance |
| 5525 is resistance |
| 5500 is support |
| 5470 is support |
| 5450 is support |
| 5425 is support |
| 5400 is support |
| 5375 is support |
| 5350 is support |
| 5325 is support |
| 5300 is support |
Stock Market Outlook for Wed Sep 11 2024
For Wednesday the Consumer Price Index report due out at 8:30 will have the most effect on the markets. The forecast is for no change at 0.2% month over month and a dip to 2.6% from 2.9% year-over-year. Core CPI monthly is expected to be unchanged at 0.2% and core CPI year-over-year is also expected to be unchanged at 3.2%.
Any increase in the numbers could see stocks slip lower depending on how higher the numbers are. A slight deviation should not affect stocks but a large deviation from estimates could change the Fed’s interest rate cut timetable.
Aside from the CPI number, the technical indicators are mixed but most are pointing higher for stocks. While the CPI report will impact stocks, the technical indicators also will have some sway and presently they are pointing higher.
Potential Economic and Political Market Moving Events
Monday:
10:00 Wholesale inventories were expected to rise slightly to 0.3%but fell to 0.2%
3:00 Consumer credit rose to $25.5 billion from $5.2 billion.
Tuesday:
6:00 AM NFIB optimism index was expected to come in at 98.6, but came in at 91.2 showing a decline in optimism.
Wednesday:
8:30: Consumer Price Index is estimated to be unchanged at 0.2%
8:30 CPI year-over-year is expected to come in lower at 2.6% down from 2.9%
8:30 Core CPI is estimated to be unchanged at 0.2%
8:30 Core CPI year-over-year is also expected to be unchanged at 3.2%
