Tuesday saw another new correction low as the S&P fell to 3958 over the lunch hour. The close saw a slight gain of 9 points but the S&P did close at 4001, holding onto the 4000 support level.
The NASDAQ rose 114 points to close at 11,737.
Tuesday saw wide swings, especially in the Dow but the close showed that investors remain focused on the inflation numbers due out on Wednesday.
Let’s review the technical indicators from Tuesday’s trading to see what to expect for Wednesday.
Stock Market Outlook Chart Comments At The Close on Tue May 10 2022
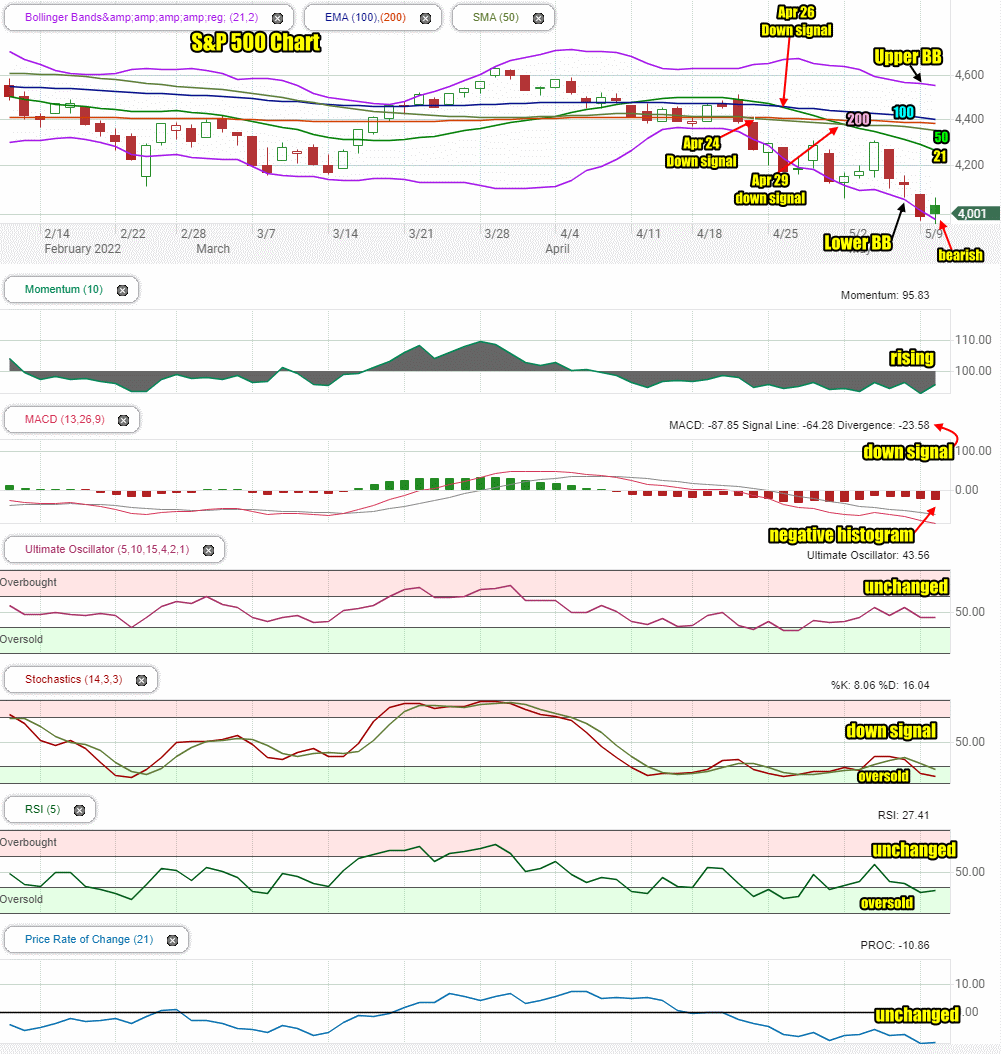
On Tuesday the day ended with a bearish candlestick that still offered some hope of a bounce.
The Upper Bollinger Band is continuing to fall deeper but the Upper Bollinger Band, while moving lower is slowing its descent which often signals a potential bounce.
All moving averages are still bearish and there are still three sell signals in the index. All the major moving averages are falling including the 200 day. The 21 day is falling rapidly and the 100 day is likely to move below the 200 day and 50 day this week unless a rally can start. At present that seems unlikely. A bounce is more likely than a rally.
The chart is 90% bearish for Wednesday. All the bounces over the past three weeks have failed. That continues to build selling pressure and pushes stocks still lower. Stocks though are becoming more attractive with each downturn and at one point a rally will recover many stocks, especially those stocks that have solid balance sheets and earnings. Those will shoot higher quickly in any rally.
Stock Market Outlook review of Tue May 10 2022
Stock Market Outlook: Technical Indicators Review:
Momentum: Momentum is rising and negative. It remains more sideways than up or down and is oversold signaling a potential for a bounce.
- Settings: For momentum I use a 10 period when studying market direction.
MACD Histogram: MACD (Moving Averages Convergence / Divergence) issued a down signal Friday April 8. On Tuesday the down signal strengthened. The MACD histogram also gained strength to the downside.
- Settings: For MACD Histogram, I am using the Fast Points set at 13, Slow Points at 26 and Smoothing at 9.
Ultimate Oscillator: The Ultimate Oscillator is unchanged and negative.
- Settings: The Ultimate Oscillator settings are: Period 1 is 5, Period 2 is 10, Period 3 is 15, Factor 1 is 4, Factor 2 is 2 and Factor 3 is 1. These are not the default settings but are the settings I use with the S&P 500 chart set for 1 to 3 months.
Slow Stochastic: The Slow Stochastic still has a down signal in place and is deep into oversold readings. A bounce could occur at any time.
Settings: For the Slow Stochastic I use the K period of 14 and D period of 3. The Slow Stochastic tries to predict the market direction further out than just one day.
Relative Strength Index: The RSI signal is primarily unchanged and into oversold readings.
- Settings: The relative strength index is set for a period of 5 which gives it 5 days of market movement to monitor. It is often the first indicator to show an overbought or oversold signal.
Rate of Change: The rate of change signal is unchanged and at levels where normally a bounce could be expected.
- Settings: Rate Of Change is set for a 21 period. This indicator looks back 21 days and compares price action from the past to the present. With the Rate Of Change, prices are rising when signals are positive. Conversely, prices are falling when signals are negative. As an advance rises the Rate Of Change signal should also rise higher, otherwise the rally is suspect. A decline should see the Rate Of Change fall into negative signals. The more negative the signals the stronger the decline.
Support and Resistance Levels To Be Aware Of:
4400 is resistance
4370 is light support
4350 is light resistance
4300 is light resistance
4290 is light resistance
4270 is light resistance
4250 is resistance
4225 is light resistance
4200 is light resistance
4150 is light resistance
4100 is light support
4050 is light support
4025 is light support
4000 is good support
3975 is light support and is a decline of 17.5%
3900 is light support and is a decline of 19%
3850 is good support and is a decline of 20%
3600 is good support at is a decline of 25%
Stock Market Outlook for Tomorrow – Wed May 11 2022
Wednesday will be all about the CPI number. The inflation numbers out of Europe and China are not encouraging. Analysts are hoping the CPI numbers on Wednesday will point to a peaking of the inflation rate. There are some signs it could but based on other countries, there is also the sign that inflation may be somewhat higher.
The market is at a point where it could spring back for more than a single day. An encouraging inflation number would be a catalyst to start a bounce. For now though, the bias is still lower, but it won’t take much to send the SPX higher for at least a day if not two.
I added into the support and resistance chart above some of the more important valuations below 4000. You can see that a full 25% decline would place the SPX at 3600. While its anyone’s guess if the selling will reach that level, the NASDAQ is already down 28% from its high and there are many tech stocks that have been crushed in the sell-off which are sitting at attractive prices. The lower the tech stocks fall, the more attractive these become but many are already down well beyond 28%.
Potential Market Moving Events
Wednesday:
This is the “big” day for markets. Higher than expected percentages will push markets lower.
8:30 Consumer Price Index which if higher than 1.2% will move the market lower.
8:30 Core CPI which is forecast to be 0.4%.
8:30 CPI year-over-year which needs to come in below 7.5% to alert the market direction lower
8:30 Core CPI year-over-year which was 6.4% previously. A lower percentage is needed
2:00 Federal Budget which won’t affect the markets this time around.
Thursday:
8:30 Initial jobless claims and continuing jobless claims
8:30 Producer price index which is expected to be half a percent.
Friday:
10:00 Consumer Sentiment Index (UofMich)
10:00 5 Year inflation expectations (UofMich)
Stock Market Outlook Archives

Morning Investing Strategy Notes for Fri Apr 4 2025

Stock Market Outlook for Fri Apr 4 2025 – All About The March Jobs Numbers

Morning Investing Strategy Notes for Thu Apr 3 2025

Stock Market Outlook for Thu Apr 3 2025 – Bearish Following Higher Than Expected Tariffs

Morning Investing Strategy Notes for Wed Apr 2 2025

Stock Market Outlook for Wed Apr 2 2025 – Tariffs Day – Still Bearish – Bounce Attempt Likely

Morning Investing Strategy Notes for Tue Apr 1 2025

Stock Market Outlook for Tue Apr 1 2025 – Nice Bounce But Still Bearish

Morning Investing Strategy Notes for Mon Mar 31 2025

Stock Market Outlook for Mon Mar 31 2025 – Bounce Attempt Likely But Still Bearish

Morning Investing Strategy Notes for Fri Mar 28 2025

Stock Market Outlook for Fri Mar 28 2025 – Weakness Into The Weekend

Morning Investing Strategy Notes for Thu Mar 27 2025

Stock Market Outlook for Thu Mar 27 2025 – Bounce Attempt

Morning Investing Strategy Notes for Wed Mar 26 2025

Stock Market Outlook for Wed Mar 26 2025 – A Little Weakness But Still Higher

Morning Investing Strategy Notes for Tue Mar 25 2025
Stock Market Outlook for Tue Mar 25 2025 – MACD Up Signal Confirmed

Morning Investing Strategy Notes for Mon Mar 24 2025
