 Prior Trading Day Summary:
On Tuesday stocks gave back some of the gains from Monday’s massive rally but there was still some strength but selling was more dominant. Investors still remain cautious of the move above the 200 day moving average and that could lead to a retest of the 200 day if investors pullback from buying.
The S&P closed up 9 points to close at 5776 in a choppy day of trading. 54% of stock were declining and 52% of all trades were to the downside.
The NASDAQ closed up 83 points to end the day at 18271. New 52 week lows rose to 164 from 102 yesterday and 57% of all volume was moving lower along with 59% of stocks.
Let’s review the SPX technical indicators at the close on Tue Mar 25 2025 to see how stocks will move on Wed Mar 26 2025.
Stock Market Outlook: SPX Closing Chart For Tue Mar 25 2025
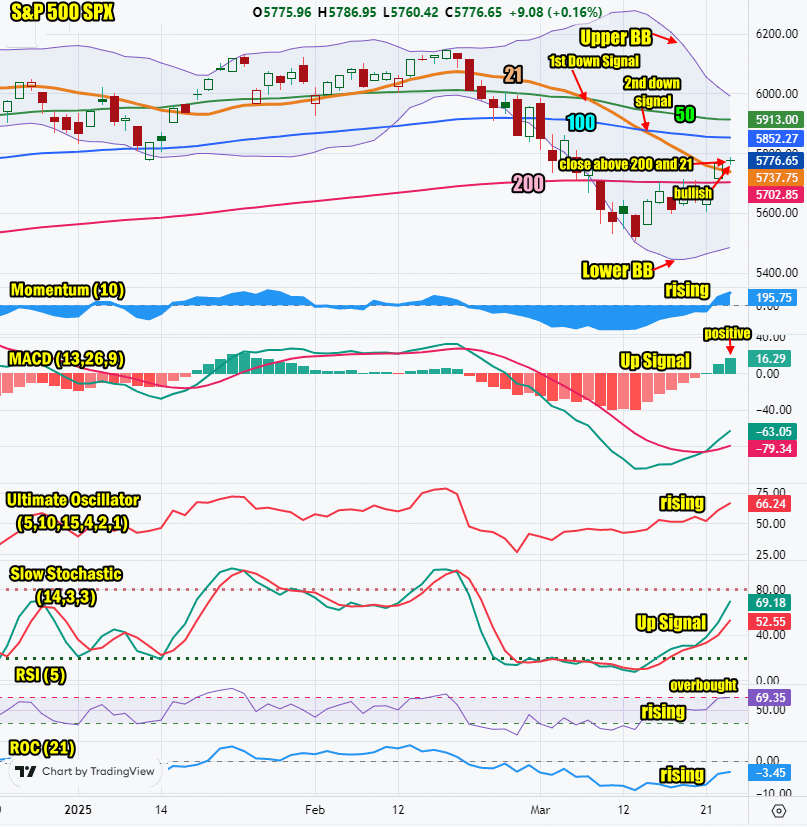
The index closed above the 200 day and 21 day for a second day. This is bullish.
The closing candlestick has two shadows and closed almost unchanged. This shows indecision from investors and a dip is expected on Wednesday. The candlestick is still bullish but cautionary.
The 21 day moving average is back falling and closed at 5737 which is bearish. The 21 day moving average fell below the 50 day on Friday Mar 7 and on Thursday Mar 13 it fell below the 100 day for a second down signal.
The 50 day moving average is falling and closed at 5913 which is bearish but showing the decline is slowing.
The 100 day moving average is falling and closed at 5852 which is bearish but showing the decline is slowing.
The 200 day moving average is rising and closed at 5702 for a third day which is bullish.
The Lower Bollinger Band is turning up which is bullish. The Upper Bollinger Band is turning lower which may signal a chance the selling is ending. We may see a Bollinger Bands Squeeze this week and a move higher.
For Wednesday the SPX chart is showing some bullish signs but bearish signals are still dominating.

SPX Stock Market Outlook review of Tue Mar 25 2025
Stock Market Outlook: Technical Indicators Review
Momentum: Momentum is rising and positive.
|
MACD Histogram: MACD (Moving Averages Convergence / Divergence) issued an up signal on Friday Mar 21 2025. The up signal was was strong Tue Mar 25 2025.
|
Ultimate Oscillator: The Ultimate Oscillator is rising and positive.
|
Slow Stochastic: The Slow Stochastic has an up signal in place and rising sharply.
|
Relative Strength Index: The RSI signal is rising and into overbought readings.
|
| Rate of Change: The rate of change signal is rising signaling a higher close is expected. Settings: Rate Of Change is set for a 21 period. This indicator looks back 21 days and compares price action from the past to the present. With the Rate Of Change, prices are rising when signals are positive. Conversely, prices are falling when signals are negative. As an advance rises, the Rate Of Change signal should also rise higher, otherwise the rally is suspect. A decline should see the Rate Of Change fall into negative signals. The more negative the signals the stronger the decline. |
Stock Market Outlook: Support and Resistance Levels |
| 6000 is resistance |
| 5970 is resistance |
| 5950 is resistance |
| 5900 is resistance |
| 5890 is resistance |
| 5875 is resistance |
| 5850 is resistance |
| 5800 is resistance |
| 5775 is resistance |
| 5750 is resistance |
| 5730 is resistance |
| 5700 is support |
| 5650 is support |
| 5630 is support |
| 5600 is support |
| 5585 is support |
| 5550 is support |
| 5500 is support |
| 5450 is support |
Stock Market Outlook for Wed Mar 26 2025
Technical indicators are continuing to turn bullish. The Moving Average Convergence / Divergence (MACD) technical indicator was stronger again on Tuesday.
The closing candlestick on Tuesday was cautionary but bullish. Investors remain cautious of the rally, especially with the market above the 200 day moving average. Volume and stocks showed more declines than advances on Tuesday which is bearish. A retest of the 200 day could occur and that might end up being bearish.
On Tuesday new homes sales surprised with their strength coming in at 676,000 from 657,000 prior. This shows the house market continues to do defy analysts. Consumer confidence however dipped to 92.9 from 100.1 prior. While still a strong number, there are sign consumers are a bit cautious.
For Wednesday, the outlook is still bullish but weakness, especially in the morning, should be expected. A higher close is anticipated to end the day but volumes need to swing toward advances and more stocks need to climb versus those falling, otherwise the rally won’t have staying power.
Potential Economic and Political Market Moving Events
Monday:
9:45 S&P flash services PMI rose more than estimated to 54.3 from 51.0 prior
9:45 S&P flash manufacturing PMI dropped more than estimated to 49.8 from 52.7 prior
Tuesday:
9:00 S&P Case Shiller home price index irose higher than estimated at 4.7% from 4.5% prior
10:00 Consumer confidence dipped to 92.9 from 100.1 prior indicating some concerns from consumers.
10:00 New home sales rose more than estimated to 676,000 from 657,000 prior
Wednesday:
8:30 Durable goods orders are estimated to have dropped -1.0%

 Prior Trading Day Summary: