
 Prior Trading Day Summary:
 Prior Trading Day Summary:
On Tuesday stocks fell further but also attempted a couple of rebounds on rising volume.
The SPX saw 6.3 billion shares traded with 45% of the volume advancing by the close. 58% of all stocks though were still falling and the index closed down 42 points at 5572.
The NASDAQ traded 9.4 billion shares and had 432 new 52 week lows. 59% of the volume by the close was advancing but 51% of stocks were still falling. The index lost just 32 points to close at 17436.
Intraday the SPX fell to 5528, another new sell-off low. The NASDAQ fell to 17,238. Both indexes intraday also went positive as tariffs remained front and center again on Tuesday.
With stocks still deeply oversold, investors are extremely cautious ahead of Wednesday’s CPI numbers and Thursday’s PPI numbers. Both of these could send stocks lower, especially in the present nervous environment.
Let’s review the SPX technical indicators from Tue Mar 11 2025 to see what to expect for Wed Mar 12 2025.
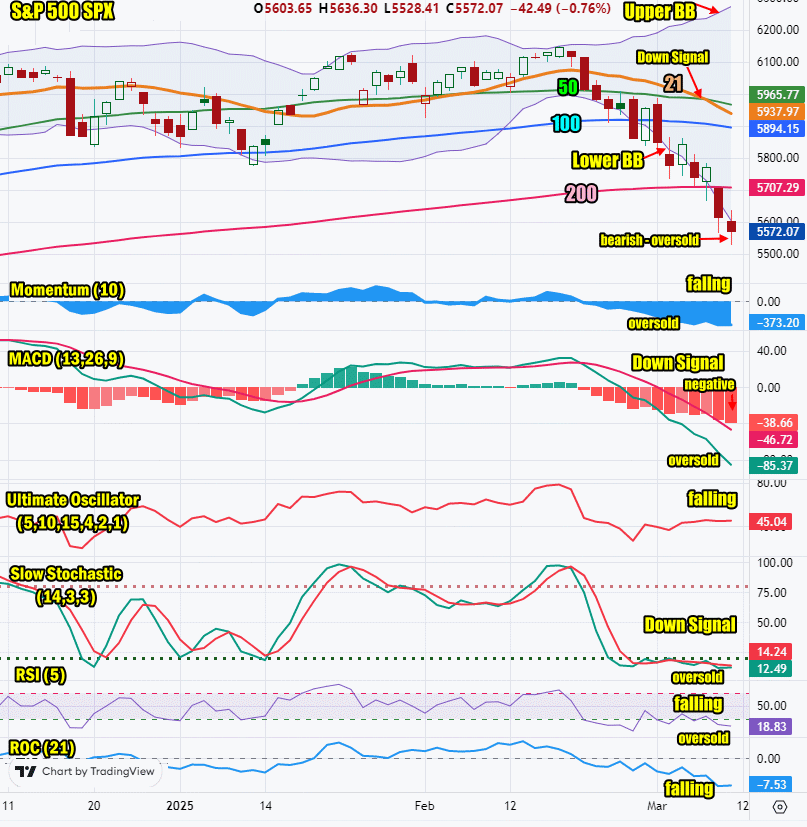
Stock Market Outlook: SPX Closing Chart For Tue Mar 11 2025
For a second straight day, the index traded below the 200 day moving average the entire day on Tuesday. This is bearish.
The closing candlestick has two long shadows suggesting both a chance for a bounce but also a lower close on Wednesday. The candlestick indicates deeply oversold for the SPX.
The 21 day moving average is falling and closed at 5937 which is bearish. The 21 day moving average fell below the 50 day on Friday which is a major down signal.
The 50 day moving average is falling and closed at 5965 which is bearish.
The 100 day moving average is falling and closed at 5894 which is bearish.
The 200 day moving average is falling and closed at 5707 which is bearish.
The Lower Bollinger Band is falling which is bearish at present. The Upper Bollinger Band is climbing which is bearish, suggesting more downside to come.
For Wednesday the SPX chart is strongly bearish despite signaling the SPX is very oversold.
SPX Stock Market Outlook review of Tue Mar 11 2025
Stock Market Outlook: Technical Indicators Review
Momentum: Momentum is falling, negative and deeply oversold.
|
MACD Histogram: MACD (Moving Averages Convergence / Divergence) issued a down signal on Mon Feb 21 2025. The down signal was stronger on Tue Mar 11 2025. It is at levels signaling the SPX is deeply oversold.
|
Ultimate Oscillator: The Ultimate Oscillator is falling slightly indicating more room to the downside still..
|
Slow Stochastic: The Slow Stochastic has a down signal in place and is deeply oversold.
|
Relative Strength Index: The RSI signal is falling and deeply oversold.
|
Rate of Change: The rate of change signal is falling, signaling Wednesday will end lower.
|
Stock Market Outlook: Support and Resistance Levels |
| 6000 is resistance |
| 5970 is resistance |
| 5950 is resistance |
| 5900 is resistance |
| 5890 is resistance |
| 5875 is resistance |
| 5850 is resistance |
| 5800 is resistance |
| 5775 is resistance |
| 5750 is support |
| 5730 is support |
| 5700 is support |
| 5650 is support |
| 5630 is support |
| 5600 is support |
| 5585 is support |
| 5550 is support |
| 5500 is support |
| 5450 is support |
Stock Market Outlook for Wed Mar 12 2025
On Tuesday, news of a meeting between Ontario and Washington regarding tariffs including Ontario suspending for now its 25% electricity surcharge, coupled with news of a potential Ukraine-Russia 30 day ceasefire was all stocks needed to try a major afternoon rally. Stocks shots higher into the afternoon before sellers returned and took profits. It’s obvious that without some kind of resolution on tariffs with Canada, stocks are probably heading nowhere and indeed will probably move lower. The correction has been all about tariffs but once consumers begin to pullback on spending the economy will enter a recession. That is the concern now for investors and consumers alike and a sustainable rally will be very hard to happen. That means bounces like Tuesday afternoon, need to be used to reduce exposure. On Thursday we could see some positive news on tariffs with Canadian representatives meeting with American counterparts, but any bounce at present is nothing more than a bounce.
On Wednesday we get the latest Consumer Price Index numbers at 8:30. If they are in-line with estimates stocks may not react but if they are higher than estimated, stocks will move lower. If you check the estimates in the chart below for today, you can see that estimates have all the CPI numbers as being lower. Any change higher, will be tough on stocks.
Potential Economic and Political Market Moving Events
Monday:
There are no economic reports
Tuesday:
6:00 NFIB optimism index was lower than estimated coming in at 100.7
10:00 Job openings came in higher than estimated at 7.7 million
Wednesday:
8:30 Consumer Price Index os estimated to have fallen to 0.3% from 0.5%
8:30 CPI year-over-year is estimated to have fallen to 2.9% from 3.0% prior
8:30 Core CPI is estimated to have fallen to 0.3% from 0.4% prior
8:30 Core CPI year-over-year is estimated to have fallen to 3.2% from 3.3%
2:00 Monthly Federal budget is estimated at $-292.5 billion