 Stocks started Tuesday with a dip down to 4375 touching the 21 day moving average by 10:10. That dip brought in buyers who pushed back against sellers. The index by the close was sitting at another new high of 4423, after reaching 4429 intraday.
The NASDAQ rose 80 points to close at 14761 just 102 points below its all-time high.
Volumes rose on Tuesday on both indexes but so did the number of new 52 week lows. The SPX looks more like it is moving sideways despite making another new high on Tuesday. The NASDAQ is moving sideways.
Let’s review the closing technical indicators for Tuesday to see what to expect for Wednesday.
Stock Market Outlook Chart Comments At The Close on Tue Aug 3 2021
On Tuesday the S&P closed higher after bouncing off the 21 day moving average. This left behind a bullish candlestick for Wednesday.
The Upper Bollinger Band has is back climbing while the Lower Bollinger Band fell back to the 50 day moving average. Both signals are still somewhat bullish, as a Bollinger Bands Squeeze is starting.
All the major moving averages are still climbing which is bullish. The chart remains dominantly bullish for the third trading day of August.

Stock Market Outlook review of Tue Aug 3 2021
Stock Market Outlook: Technical Indicators Review:
Momentum: Momentum is falling despite the rally and new high on Tuesday.
- Settings: For momentum I use a 10 period when studying market direction.
MACD Histogram: MACD (Moving Averages Convergence / Divergence) issued an up signal on Mon Jul 26. On Mon Aug 2 2021 an unconfirmed down signal was seen at the end of the day. On Tue Aug 3 2021 the signal was neutral.
- Settings: For MACD Histogram, I am using the Fast Points set at 13, Slow Points at 26 and Smoothing at 9.
Ultimate Oscillator: The Ultimate Oscillator is rising after five days of moving lower.
- Settings: The Ultimate Oscillator settings are: Period 1 is 5, Period 2 is 10, Period 3 is 15, Factor 1 is 4, Factor 2 is 2 and Factor 3 is 1. These are not the default settings but are the settings I use with the S&P 500 chart set for 1 to 3 months.
Slow Stochastic: The Slow Stochastic has a down signal in place and is still overbought.
Settings: For the Slow Stochastic I use the K period of 14 and D period of 3. The Slow Stochastic tries to predict the market direction further out than just one day.
Relative Strength Index: The RSI signal is rising.
- Settings: The relative strength index is set for a period of 5 which gives it 5 days of market movement to monitor. It is often the first indicator to show an overbought or oversold signal.
Rate of Change: The rate of change signal is sideways or unchanged. The rally failed to turn this signal higher.
- Settings: Rate Of Change is set for a 21 period. This indicator looks back 21 days and compares price action from the past to the present. With the Rate Of Change, prices are rising when signals are positive. Conversely, prices are falling when signals are negative. As an advance rises the Rate Of Change signal should also rise higher, otherwise the rally is suspect. A decline should see the Rate Of Change fall into negative signals. The more negative the signals the stronger the decline.
Support and Resistance Levels To Be Aware Of:
4400 is resistance
4370 is resistance
4350 is light support
4300 is light support
4290 is light support
4270 is light support
4250 is light support
4225 is light support
4200 is light support
4175 is light support
4150 is light support
4100 is good support
4070 is light support
4050 is light support
4000 is good support
3900 is support
3850 is support
3800 is support
3750 is good support
3700 is light support
3680 is light support
3600 is strong support
Stock Market Outlook for Tomorrow – Wed Aug 4 2021
For Tuesday a second bounce was expected which investors got. A number of the technical indicators by the close however were rather unimpressed with the rally. MACD did not confirm Monday’s down signal however, which is a good sign for the bulls. It did not however give a new up signal which is a plus for the bears.
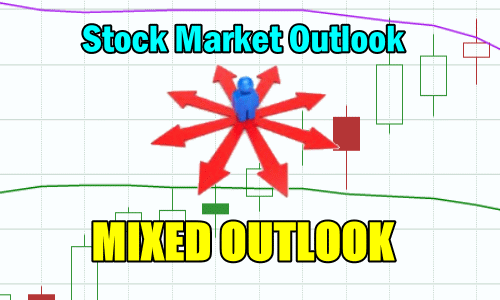
The Slow Stochastic is almost neutral with its signal. Momentum turned lower despite the rally which is bearish. The Ultimate Oscillator and the Relative Strength Index (RSI) are both turn higher. All of this leaves us with a mixed outlook for Wednesday with a potential for a move still higher.
With the unemployment report due out on Friday we could see the index climb slightly on Wednesday and then move higher in the afternoon on Thursday ahead of Friday’s unemployment report from July.
For tomorrow however, expect choppy trading with dips very likely but a strong chance for a slightly higher close again despite the overall mixed outlook.
Stock Market Outlook Archives
Stock Market Outlook for Fri Sep 27 2024 – Choppy – Dips Likely But Higher

Morning Investing Strategy Notes for Thu Sep 26 2024

Stock Market Outlook for Thu Sep 26 2024 – Choppy – Dip Possible But Still Up
Morning Investing Strategy Notes for Wed Sep 25 2024
Stock Market Outlook for Wed Sep 25 2024 – Bigger Dip Possible But Higher Close Expected

Morning Investing Strategy Notes for Tue Sep 24 2024
Stock Market Outlook for Tue Sep 24 2024 – Overbought But Bias Up

Morning Investing Strategy Notes for Mon Sep 23 2024
Stock Market Outlook for Mon Sep 23 2024 – Still Overbought – Dips Likely But Higher Close

Morning Investing Strategy Notes for Fri Sep 20 2024
Stock Market Outlook for Fri Sep 20 2024 – Overbought – Dips Like But Bullish

Morning Investing Strategy Notes for Thu Sep 19 2024
Stock Market Outlook for Thu Sep 19 2024 – Higher Following Fed Rate Cut

Morning Investing Strategy Notes for Wed Sep 18 2024
Stock Market Outlook for Wed Sep 18 2024 – All About The Fed