The opening started with promise as the S&P tried again to break to 4600. That failed and the index slipped lower. Then hawkish comments from two Fed Presidents, Brainard and Daly intraday really got selling going. In particular Brainard who was considered more dovish came across hawkish on concerns with inflation and an aggressive draw-down of the Fed balance sheet. Her comments caught investors by surprise and selling dominated the remainder of the day. The indexes closed just off the lows of the day.
The S&P fell 1.2% losing 57 points to close at 4525. The NASDAQ lost 2.26% losing 328 points to close at 14204.
The technical indicators at the close on Tuesday are a concern heading into Wednesday.
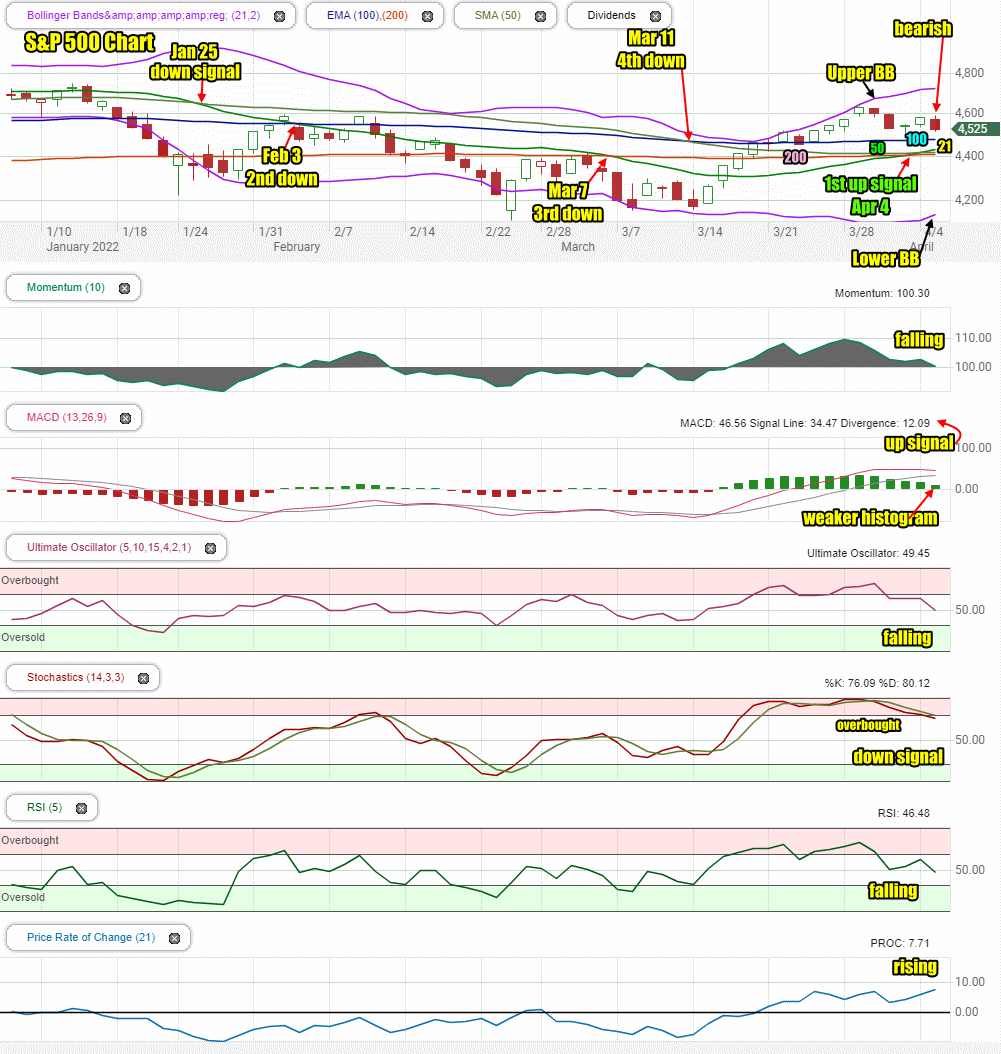
Stock Market Outlook Chart Comments At The Close on Tue Apr 5 2022
The 21 day moving average continued to climb above the 50 and 200 day moving average which is bullish.
The closing candlestick is bearish for Wednesday and is signaling a lower day is ahead.
Meanwhile the Upper Bollinger Band turned sideways on Tuesday but the Lower Bollinger Band finally turned up which is bearish.
The 200 day moving average is back at the 4400 level which is bullish. The 50 day has continued to stay above the 200 day which is bullish. The 100 day moving average is trending sideways. These are all bullish signs.
The SPX still has 4 down signals in place and 1 up signal.
The chart is still more bearish than bullish for Wednesday and the change in the Bollinger Bands and closing candlestick are very bearish for Wednesday.
Stock Market Outlook review of Tue Apr 5 2022
Stock Market Outlook: Technical Indicators Review:
Momentum: Momentum is falling and ready to turn negative.
- Settings: For momentum I use a 10 period when studying market direction.
MACD Histogram: MACD (Moving Averages Convergence / Divergence) issued an up signal Wed Mar 16 2022. On Tuesday both the MACD up signal and the histogram have lower readings than we saw on prior days. The histogram in particular is advising weakness in the up signal has grown steadily.
- Settings: For MACD Histogram, I am using the Fast Points set at 13, Slow Points at 26 and Smoothing at 9.
Ultimate Oscillator: The Ultimate Oscillator is falling and turned bearish.
- Settings: The Ultimate Oscillator settings are: Period 1 is 5, Period 2 is 10, Period 3 is 15, Factor 1 is 4, Factor 2 is 2 and Factor 3 is 1. These are not the default settings but are the settings I use with the S&P 500 chart set for 1 to 3 months.
Slow Stochastic: The Slow Stochastic has a down signal in place and is leaving overbought.
Settings: For the Slow Stochastic I use the K period of 14 and D period of 3. The Slow Stochastic tries to predict the market direction further out than just one day.
Relative Strength Index: The RSI signal is falling and bearish.
- Settings: The relative strength index is set for a period of 5 which gives it 5 days of market movement to monitor. It is often the first indicator to show an overbought or oversold signal.
Rate of Change: The rate of change signal is rising which is advises that prices may have large moves on Wednesday up or down.
- Settings: Rate Of Change is set for a 21 period. This indicator looks back 21 days and compares price action from the past to the present. With the Rate Of Change, prices are rising when signals are positive. Conversely, prices are falling when signals are negative. As an advance rises the Rate Of Change signal should also rise higher, otherwise the rally is suspect. A decline should see the Rate Of Change fall into negative signals. The more negative the signals the stronger the decline.
Support and Resistance Levels To Be Aware Of:
4650 is resistance
4640 is resistance
4625 is resistance
4600 is strong resistance
4590 is resistance
4575 is light support
4560 is support
4550 is light support
4525 is light support
4500 is support
4490 is light support
4475 is light support
4450 is light support
4400 is support
4370 is light support
4350 is light support.
4300 is good support
Stock Market Outlook for Tomorrow – Wed Apr 6 2022
For Wednesday the signals are bearish. There is a chance for a bounce near the open but it is unlikely and if there is a bounce, it won’t hold.
The technical indicators are showing that Tuesday’s drop has placed large weakness into the market. The Lower Bollinger Band rising is a concern. The drop in strength of the MACD up signal is another concern. The Rate Of Change showing larger price movements should be expected.
The break of 4500 and 4475 is likely on Wednesday as investors mull over Fed hawkish statements on Tuesday and the Fed minutes on Wednesday which are released at 2:00 PM. A close below the 100 day moving average is likely on Wednesday. Three Fed Presidents speak on Wednesday and will probably create more pressure as they are bound to hawkish in their comments. Bullard speaks before the open which will probably assist in the market opening lower.
Near the open and especially if there is a bounce on Wednesday I will be buying SPY put options for April 15 expiry at the $440 put strike.
Potential Market Moving Events
These are the events this week that could move markets.
Tuesday
On Tuesday we found that the Foreign Trade Deficit was slightly higher than expected by $1 billion at negative $89.2 billion.
Wednesday
2:00 FOMC minutes which could move the market
8:30 Initial Jobless Claims and continuing jobless claims are reported.
9:00 Fed President Bullard speaks on the economy – could see some market movement before the open depending on how hawkish or dovish his speech is.
2:00 Fed Bank Presidents Evan and Bostic speak. They could move markets lower if hawkish.
Friday
10:00 Whole inventories which are expected to come in a 2.1% which is unchanged.
Stock Market Outlook Archives

Quick Morning Comments – Tue Mar 11 2025

Morning Investing Strategy Notes for Tue Mar 11 2025

Stock Market Outlook for Tue Mar 11 2025 – Deeply Oversold – Bounce Expected

Morning Investing Strategy Notes for Mon Mar 10 2025
Stock Market Outlook for Mon Mar 10 2025 – Second Bounce Attempt

Morning Investing Strategy Notes for Fri Mar 7 2025

Stock Market Outlook for Fri Mar 7 2025 – All About The February Jobs Numbers

Morning Investing Strategy Notes for Thu Mar 6 2025

Stock Market Outlook for Thu Mar 6 2025 – Volatile But Still Bullish

Morning Investing Strategy Notes for Wed Mar 5 2025

Stock Market Outlook for Wed Mar 5 2025 – Trump Bump?

Morning Investing Strategy Notes for Tue Mar 4 2025

Stock Market Outlook for Tue Mar 4 2025 – Sell-Off Continues – Possible Bounce Today But Lower

Morning Investing Strategy Notes for Mon Mar 3 2025

Stock Market Outlook for Mon Mar 3 2025 – Choppy With Higher Close

Morning Investing Strategy Notes for Fri Feb 28 2025

Stock Market Outlook for Fri Feb 28 2025 – Deeply Oversold But Still Bearish

Morning Investing Strategy Notes for Thu Feb 27 2025

Stock Market Outlook for Thu Feb 27 2025 – Second Bounce Attempt Likely

