 Prior Trading Day Summary:
Monday saw a wicked start to the day but a rumor on a delay in implementing tariffs stopped the selling despite the White House denying the rumor.
In a dramatic reversal the indexes all rallied strongly and at a couple of points all 3 indexes were positive.
The S&P ended the day down just 11 points to 5062 on huge volume of 8.8 billion. There was just 1 new 52 week high on Monday but 1161 new 52 week lows.
The NASDAQ saw 12.7 billion shares traded, with 1611 new 52 week lows. The day ended positive with a gain of 15 points to close at 15,603.
Let’s review the technical indicators at the close on Mon Apr 7 2025 to see what to expect for stocks on Tue Apr 8 2025.
Stock Market Outlook: SPX Closing Chart For Mon Apr 7 2025
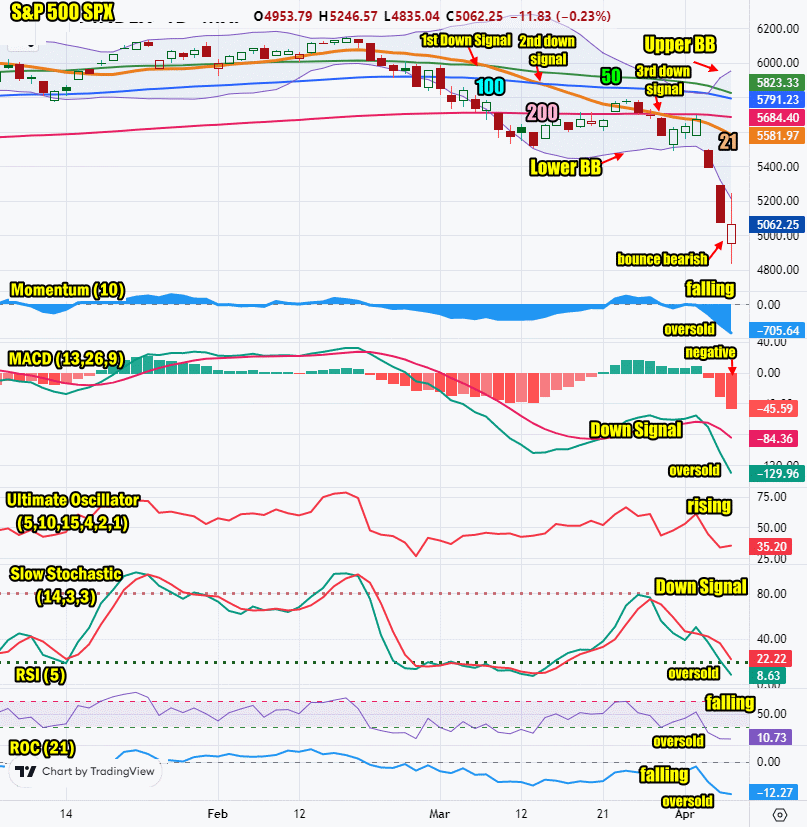
The index closed just below Friday’s close but the index still saw a strong rally from the early morning sell-off. This is bearish and often is followed by another day of a bounce attempt.
The closing candlestick showed a deep early morning sell-off and a strong rally to try to regain 5200. The candlestick is very bearish but with two long shadows, its points to a chance for a rally but a probable lower close.
The 21 day moving average is falling and closed at 5581 which is bearish. The 21 day moving average fell below the 50 day on Friday Mar 7/ It fell below the 100 day on Thursday Mar 13 for a second down signal and on Friday Mar 28 it fell below the 200 day for a third down signal.
The 50 day moving average is falling and closed at 5823 which is bearish.
The 100 day moving average is falling and closed at 5791 which is bearish.
The 200 day moving average is falling and closed at 5684 which is bearish.
The Lower Bollinger Band is falling sharply signaling more downside is ahead. The Upper Bollinger Band is turning sharply higher which signals more downside ahead.
For Tuesday the SPX chart is still strongly bearish but there is a chance for a second bounce although the day looks weak with a probable lower close.

SPX Stock Market Outlook review of Mon Apr 7 2025
Stock Market Outlook: Technical Indicators Review
Momentum: Momentum is falling and negative. It is very oversold.
|
MACD Histogram: MACD (Moving Averages Convergence / Divergence) issued a down signal on Thu Apr 3 2025. On Mon Apr 7 2025 the down signal was very strong. The signals are at levels considered oversold and a bounce is likely.
|
Ultimate Oscillator: The Ultimate Oscillator is rising slightly and negative.
|
Slow Stochastic: The Slow Stochastic has a strong down signal in place and is oversold.
|
Relative Strength Index: The RSI signal is falling and extremely oversold and at a reading of 10.78 a bounce should be expected.
|
| Rate of Change: The rate of change signal is falling and signaling a lower close is expected on Tuesday. Settings: Rate Of Change is set for a 21 period. This indicator looks back 21 days and compares price action from the past to the present. With the Rate Of Change, prices are rising when signals are positive. Conversely, prices are falling when signals are negative. As an advance rises, the Rate Of Change signal should also rise higher, otherwise the rally is suspect. A decline should see the Rate Of Change fall into negative signals. The more negative the signals the stronger the decline. |
Stock Market Outlook: Support and Resistance Levels |
| 5800 is resistance |
| 5775 is resistance |
| 5750 is resistance |
| 5730 is resistance |
| 5700 is resistance |
| 5650 is resistance |
| 5630 is resistance |
| 5600 is resistance |
| 5585 is support |
| 5550 is support |
| 5500 is support |
| 5450 is support |
| 5400 is support |
| 5230 is support |
| 5000 is support |
| 4770 is support |
| 4680 is support |
| 4500 is support |
| 4365 is support |
| 4150 is support |
| 4000 is support |
Stock Market Outlook for Tue Apr 8 2025
For Tuesday the closing signals are advising that the index should try to push still higher on Tuesday but there is an equal chance the index will close lower.
The sell-off does not look to be over but with the index still deeply oversold, stocks have a chance for a second bounce today. Late this week we get the start of bank earnings for the quarter. That could assist in putting a floor under the selling.
Potential Economic and Political Market Moving Events
Monday:
3:00 Consumer credit is estimated to decline to $15.5 billion from $18.1 billion prior
Tuesday:
6:00 AM NFIB optimism index is expected to dip to 98.7 from 100 prior

 Prior Trading Day Summary: