
Monday built a rally off of Friday’s close. Investors set aside their concerns for the global economies and all the bearish analysts and bought stocks heavily on Monday.
This pushed the S&P to close at 2867.19 just 33 points from 2900.
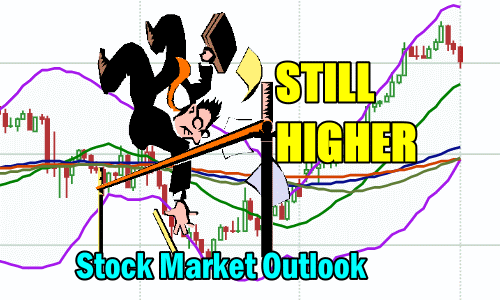
Stock Market Outlook Chart Comments At The Close on Mon Apr 1 2019
The S&P closed above the 21 day moving average again on Monday and at the Upper Bollinger Band leaving behind a bullish candlestick for Tuesday.
The Bollinger Bands Squeeze is beginning to end which is signaling a move higher for the index.
All major moving averages are back where they belong and the 50 day and 100 day are both moving away from the 200 day. The 100 and 200 day moving averages should be above the Lower Bollinger Band within another day or two, another bullish signal.
The SPX looks ready to continue its advance.

Stock Market Outlook review of Mon Apr 1 2019
Stock Market Outlook: Technical Indicators Review:
Momentum: Momentum is positive and rising.
- Settings: For momentum I use a 10 period when studying market direction.
MACD Histogram: MACD (Moving Averages Convergence / Divergence) issued a down signal on Friday March 22 2019. The down signal was almost gone on Monday with just a negative 0.36 reading. It was closer to neutral than down.
- Settings: For MACD Histogram, I am using the Fast Points set at 13, Slow Points at 26 and Smoothing at 9.
Ultimate Oscillator: The Ultimate Oscillator signal turned positive and is rising.
- Settings: The Ultimate Oscillator settings are: Period 1 is 5, Period 2 is 10, Period 3 is 15, Factor 1 is 4, Factor 2 is 2 and Factor 3 is 1. These are not the default settings but are the settings I use with the S&P 500 chart set for 1 to 3 months.
Slow Stochastic: The Slow Stochastic has an up signal in place.
- Settings: For the Slow Stochastic I use the K period of 14 and D period of 3. The Slow Stochastic tries to predict the market direction further out than just one day.
Relative Strength Index: The RSI signal is rising.
- Settings: The relative strength index is set for a period of 5 which gives it 5 days of market movement to monitor. It is often the first indicator to show an overbought or oversold signal.
Rate of Change: The rate of change signal is rising indicating higher prices are coming for equities.
- Settings: Rate Of Change is set for a 21 period. This indicator looks back 21 days and compares price action from the past to the present. With the Rate Of Change, prices are rising when signals are positive. Conversely, prices are falling when signals are negative. As an advance rises the Rate Of Change signal should also rise higher, otherwise the rally is suspect. A decline should see the Rate Of Change fall into negative signals. The more negative the signals the stronger the decline.
Support Resistance Levels To Be Aware Of:
2900 is strong resistance
2860 is resistance
2830 is light support
2800 is strong support
2795 is light support
2745 to 2750 is light support
2725 is light support
2700 is light support
2675 is light support
2650 is support
2625 is light support
2600 is support.
There was good support at the 2550 level which is back to being support.
The 2500 level is support.
The S&P has light support at 2480 and better support at 2450.
There is good support at 2425.
Below that there is some support at 2400, 2380, 2350.
2300 has the most support at present but would represent a full correction of 641 points as a drop to this level would be 21% and just 5% away from a full bear market signal ending the bull market from 2009.
Stock Market Outlook for Tomorrow – Tue Apr 2 2019
Tuesday will see the S&P slip back to below 2860 on Tuesday as it tests the 2860 level which used to be support for the index and is presently resistance.
That should hold up fine and the index should move higher and close positive. The day though should see less strength to the rally and a slightly higher close but not a major move to try to retake 2900.
That should be reached Wednesday or Thursday.
The outlook then is still higher but the S&P will be testing support around 2860 before taking on 2900.
Stock Market Outlook Archives
Stock Market Outlook for Wed Feb 5 2025 – Choppy With A Lower Close

Morning Investing Strategy Notes for Wed Feb 5 2025

Morning Investing Strategy Notes for Tue Feb 4 2025
Stock Market Outlook for Tue Feb 4 2025 – Possible Bounce But Lower Close

Morning Investing Strategy Notes for Mon Feb 3 2025
Stock Market Outlook for Mon Feb 3 2025 – Lower Close Over Tariff Worries

Morning Investing Strategy Notes for Fri Jan 31 2025
Stock Market Outlook for Fri Jan 31 2025 – Choppy – Dip Possible But Still Up

Morning Investing Strategy Notes for Thu Jan 30 2025
Stock Market Outlook for Thu Jan 30 2025 – Higher Open But Lower Close

Morning Investing Strategy Notes for Wed Jan 29 2025
Stock Market Outlook for Wed Jan 29 2025 – Bullish Even With The Fed

Morning Investing Strategy Notes for Tue Jan 28 2025
Stock Market Outlook for Tue Jan 28 2025 – Bounce Likely

Morning Investing Strategy Notes for Mon Jan 27 2025
Stock Market Outlook for Mon Jan 27 2025 – Overbought – Dips Likely – But Bullish Heading Into More Earnings

Morning Investing Strategy Notes for Fri Jan 24 2025
Stock Market Outlook for Fri Jan 24 2025 – Still Overbought – Choppy – Dips Likely – But Higher

Morning Investing Strategy Notes for Thu Jan 23 2025
Stock Market Outlook for Thu Jan 23 2025 – Overbought – Possible Flat to Lower Close
