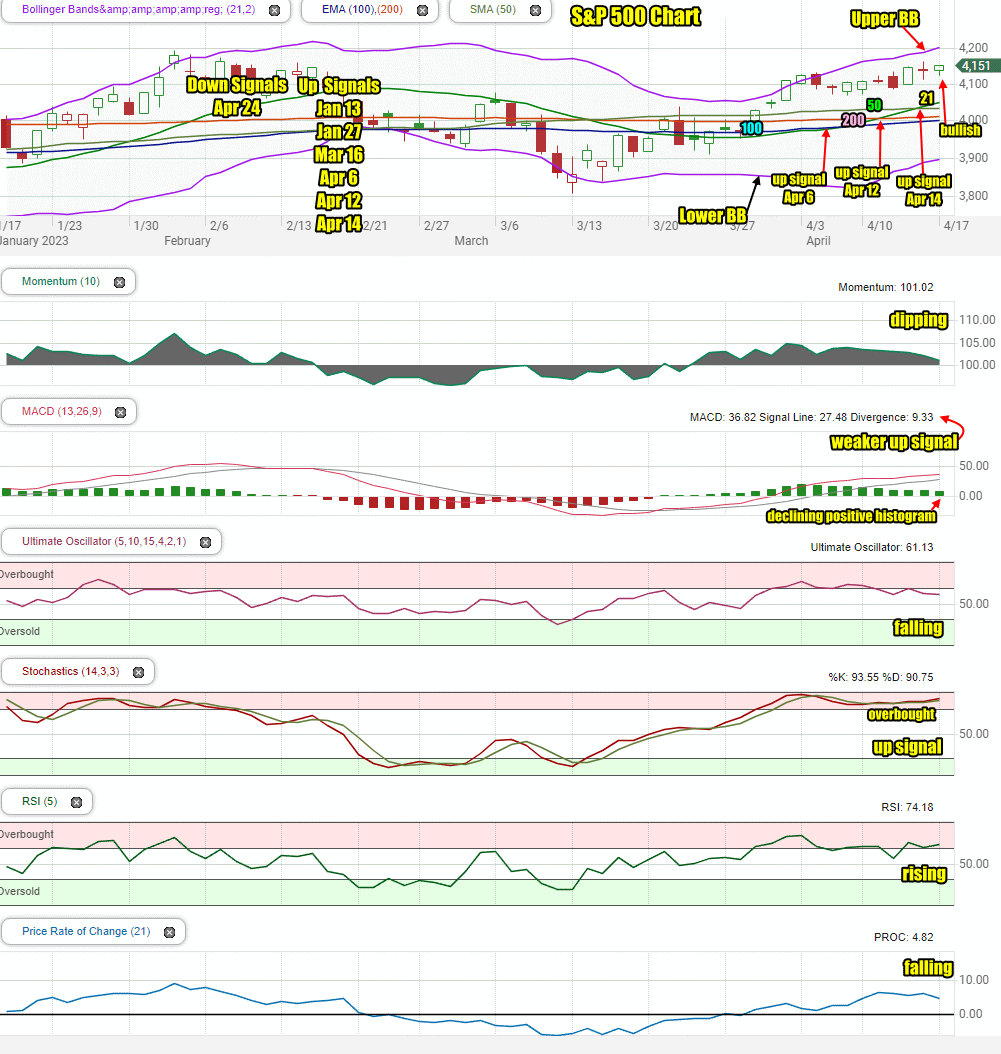
On Monday stocks dipped mid-afternoon to the 4125 support level which resulted in a strong two hour rally culminating in the SPX ending the day at 4151, the highs for the day.
The S&P gained 13 points to end the day at 4151. The NASDAQ rose 34 points to close at 12157.
Let’s review the closing technical indicators from Mon Apr 17 2023 to see what we should expect for Tue Apr 18 2023.
Stock Market Outlook Chart Comments At The Close on Mon Apr 17 2023
The index closed with a bullish candlestick for Tuesday. The candlestick also signaled once again that the market is overbought. Investors should expect some weakness throughout the day. It will not however change the bullishness of the market. The rally itself is broadening with more stocks moving above their 200 day moving averages. The index has a strong chance of moving to 4300 in April.
The Upper Bollinger Band is turning up and the Lower Bollinger Band is also turning higher. Both are bullish signals.
The 200 day moving average is climbing which is bullish. As explained, a new up signal on Friday occurred with the 21 day above the 50 day. This comes close to normalizing the market back to a bull stance and wiped out the down signal from March 14, leaving just one down signal.
The 50 day continues above the 200 day which is bullish. The 100 day is rising and should move above the 200 day perhaps by mid-week or certainly by end of the week. That will end the final down signal made April 24 2022, a year ago.
There are 6 up signal since January and just 1 down signal left. The SPX has been above the 200 day moving average for 13 trading days another bullish indicator.

Stock Market Outlook review of Mon Apr 17 2023
Stock Market Outlook: Technical Indicators Review:
Momentum: Momentum is dipping and positive.
- Settings: For momentum I use a 10 period when studying market direction.
MACD Histogram: MACD (Moving Averages Convergence / Divergence) up signal from Mar 21 lost strength again. The histogram also shows a drop in strength.
- Settings: For MACD Histogram, I am using the Fast Points set at 13, Slow Points at 26 and Smoothing at 9.
Ultimate Oscillator: The Ultimate Oscillator is falling and positive.
- Settings: The Ultimate Oscillator settings are: Period 1 is 5, Period 2 is 10, Period 3 is 15, Factor 1 is 4, Factor 2 is 2 and Factor 3 is 1. These are not the default settings but are the settings I use with the S&P 500 chart set for 1 to 3 months.
Slow Stochastic: The Slow Stochastic has an up signal in place. It is also signaling overbought.
- Settings: For the Slow Stochastic I use the K period of 14 and D period of 3. The Slow Stochastic tries to predict the market direction further out than just one day.
Relative Strength Index: The RSI signal is rising and positive. It is also signaling overbought.
- Settings: The relative strength index is set for a period of 5 which gives it 5 days of market movement to monitor. It is often the first indicator to show an overbought or oversold signal.
Rate of Change: The rate of change signal is falling but still positive.
- Settings: Rate Of Change is set for a 21 period. This indicator looks back 21 days and compares price action from the past to the present. With the Rate Of Change, prices are rising when signals are positive. Conversely, prices are falling when signals are negative. As an advance rises the Rate Of Change signal should also rise higher, otherwise the rally is suspect. A decline should see the Rate Of Change fall into negative signals. The more negative the signals the stronger the decline.
Support and Resistance Levels To Be Aware Of:
4250 is resistance
4240 is resistance
4225 is resistance
4210 is resistance
4200 is resistance
4190 is resistance
4180 is resistance
4175 is resistance
4150 is resistance
4135 is resistance
4125 is resistance
4100 is resistance
4090 is resistance
4075 is support
4050 is support
4030 is light support
4025 is light support
4000 is support
Stock Market Outlook for Tue Apr 18 2023
For Tuesday the technical indicators are mixed. A number are showing more weakness with momentum signaling the rally is slowing. Despite this, Tuesday will end higher. The opening should see a bounce attempt and then weakness will move in as investors take profits. The afternoon will see a move to end the day higher.
Potential Economic and Political Market Moving Events
Wednesday investors are treated the the Fed Beige Book at 2:00 PM.
Monday:
8:30 Housing starts
8:30 Building permits
1:00 Fed Governor Bowman speaks
