 Prior Trading Day Summary:
On Mon Mar 31 2025 stocks seemed headed for another low until buyers finally returned. The index bounced and the SPX closed up 31 points to 5612. Volume was good at 5.3 billion shares and by the close 50% of the volume was rising.
The NASDAQ closed down 24 points to end the month at 17,299.
It was the second straight month of losses for both indexes and the close of the day saw the NASDAQ with 62 new 52 week highs but a huge 698 new 52 week lows. For both indexes it has been the worst month since 2022.
The bounce was nice to finally see, but most investors were anticipating a bounce. The question is can April turn the market direction around.
Let’s review the SPX technical indicators at the close on Mon Mar 31 2025 to see if stocks might continue to rally on Tue Apr 1 2025.
Stock Market Outlook: SPX Closing Chart For Mon Mar 31 2025
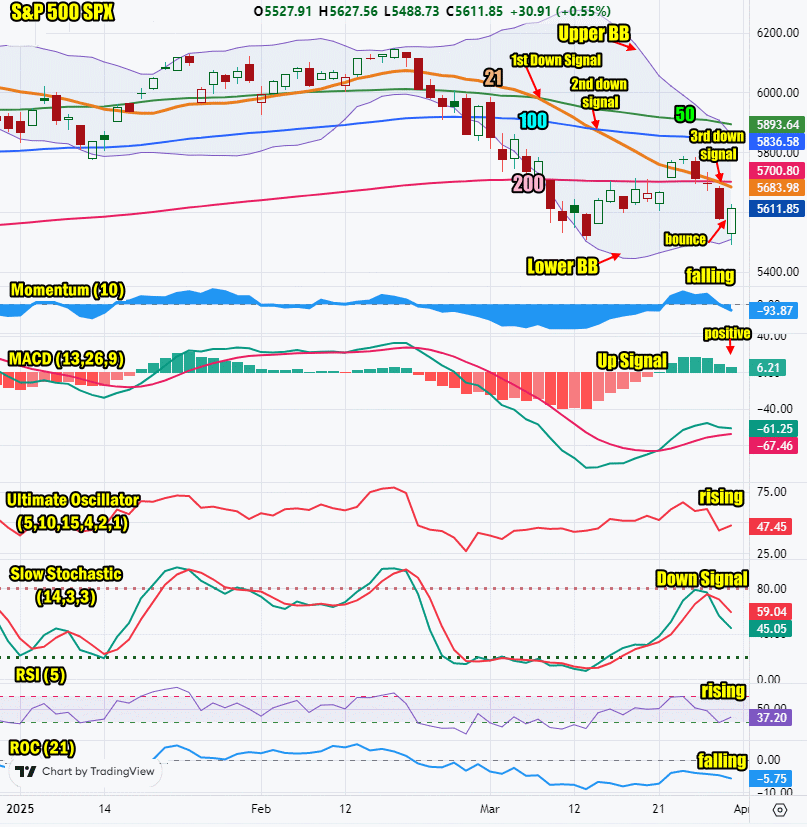
The index closed below the 200 day moving average but above the low from March 13. This is still bearish.
The closing candlestick suggests we could see some further upside on Tuesday but weakness is evident. Looking at the candlestick you can clearly see that the bounce did not recover even 50% of Friday’s decline. The outlook is for the SPX to bounce to the 21 day moving average which is now below the 200 day, and then move lower once again. A lot depends on President Trump and his tariffs.
The 21 day moving average is falling and closed at 5683 which is bearish. The 21 day moving average fell below the 50 day on Friday Mar 7/ It fell below the 100 day on Thursday Mar 13 for a second down signal and on Friday Mar 28 it fell below the 200 day for a third down signal.
The 50 day moving average is falling and closed at 5893 which is bearish.
The 100 day moving average is falling and closed at 5836 which is bearish.
The 200 day moving average is unchanged and closed at 5700 which is bearish.
The Lower Bollinger Band is turning higher which could be signaling a Bollinger Bands Squeeze may be coming within a couple of days. The Upper Bollinger Band is falling below the 50 day moving average and heading to the 100 day. Presently this is bearish but a Bollinger Bands Squeeze could see stocks try to pop.
For Tuesday the SPX chart is still strongly bearish although it is signaling the bounce could continue Tuesday.

SPX Stock Market Outlook review of Mon Mar 31 2025
Stock Market Outlook: Technical Indicators Review
Momentum: Momentum is falling and negative.
|
MACD Histogram: MACD (Moving Averages Convergence / Divergence) issued an up signal on Friday Mar 21 2025. The up signal was almost gone on Mon Mar 31 2025.
|
Ultimate Oscillator: The Ultimate Oscillator is rising and negative.
|
Slow Stochastic: The Slow Stochastic has a down signal in place.
|
Relative Strength Index: The RSI signal is rising.
|
| Rate of Change: The rate of change signal is falling signaling a lower close is expected. Settings: Rate Of Change is set for a 21 period. This indicator looks back 21 days and compares price action from the past to the present. With the Rate Of Change, prices are rising when signals are positive. Conversely, prices are falling when signals are negative. As an advance rises, the Rate Of Change signal should also rise higher, otherwise the rally is suspect. A decline should see the Rate Of Change fall into negative signals. The more negative the signals the stronger the decline. |
Stock Market Outlook: Support and Resistance Levels |
| 6000 is resistance |
| 5970 is resistance |
| 5950 is resistance |
| 5900 is resistance |
| 5890 is resistance |
| 5875 is resistance |
| 5850 is resistance |
| 5800 is resistance |
| 5775 is resistance |
| 5750 is resistance |
| 5730 is resistance |
| 5700 is support |
| 5650 is support |
| 5630 is support |
| 5600 is support |
| 5585 is support |
| 5550 is support |
| 5500 is support |
| 5450 is support |
Stock Market Outlook for Tue Apr 1 2025
For Tuesday the SPX will probably open slightly lower and then attempt to bounce perhaps after 10:00 AM. The close on Tuesday will depend greatly on what President Trump announces for his tariffs.
The technical indicators though are advising that Monday was just a very oversold bounce. The index needs to get back above the 200 day moving average and keep climbing. Until then, then outlook is still lower.
Potential Economic and Political Market Moving Events
Monday:
9:45 Chicago business barometer came in higher than expected at 47.6 which was higher than the prior reading of 45.5
Tuesday:
9:45 Final S&P US manufacturing PMI is estimated to be unchanged at 49.8
10:00 Construction spending is estimated to rise to 0.3% from -0.2% prior
10:00 ISM Manufacturing is estimated to slip to 49.5% from 50.3% prior
10:00 Job openings are estimated at 7.7 million, unchanged.
Through The Day we get auto sales which are estimated to be 16.5 million, up slightly from 26.0 million prior

 Prior Trading Day Summary: