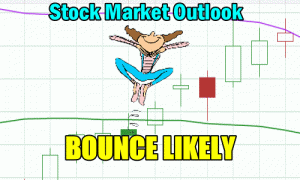
Markets roared higher on Wednesday after the Fed announced a half point rate increase. Fed Chair Powell appeared more dovish than prior comments and seemed to give a clear direction of two more half point rate hikes. By then a lot of analysts are wondering if tightening will slow. That was enough to shoot stocks higher in the latter half of the afternoon on Wednesday in a massive rally.
The S&P rose 124 points for a 3% gain closing at 4300. The NASDAQ jumped 401 points to close at 12,964. This week alone the NASDAQ has added 630 points, wiping out all of last week’s 504 point drop.
Let’s review Wednesday’s closing numbers to see what to expect for Thursday, the day ahead of the April unemployment numbers.
Stock Market Outlook Chart Comments At The Close on Wed May 4 2022
On Wednesday the closing candlestick is bullish for Thursday. Although the huge move on Wednesday afternoon will often see some selling or profit-taking on the following day. That though does not change the outlook for the remainder of the week.
The Upper Bollinger Band continues to fall but the Lower Bollinger Band is turning sideways. We could see another Bollinger Bands Squeeze next week but this one might be signaling a recovery of some degree in the index next week.
All moving averages are still bearish and there are still three sell signals in the index. That though could change quickly if the S&P candlesticks begin to close above the 21, 50 200 and then 100 day moving averages.
The chart is probably 90% bearish for Thursday but after the big rally Wednesday afternoon, any weakness on Thursday is an opportunity to setup more trades for a move higher that appears to be coming soon.

Stock Market Outlook review of Wed May 4 2022
Stock Market Outlook: Technical Indicators Review:
Momentum: Momentum is rising and negative.
- Settings: For momentum I use a 10 period when studying market direction.
MACD Histogram: MACD (Moving Averages Convergence / Divergence) issued a down signal Friday April 8. On Wednesday the down signal was cut in half. The histogram also lost a lot of its bearish strength.
- Settings: For MACD Histogram, I am using the Fast Points set at 13, Slow Points at 26 and Smoothing at 9.
Ultimate Oscillator: The Ultimate Oscillator is rising and back positive.
- Settings: The Ultimate Oscillator settings are: Period 1 is 5, Period 2 is 10, Period 3 is 15, Factor 1 is 4, Factor 2 is 2 and Factor 3 is 1. These are not the default settings but are the settings I use with the S&P 500 chart set for 1 to 3 months.
Slow Stochastic: The Slow Stochastic has an up signal in place and leaving oversold readings.
Settings: For the Slow Stochastic I use the K period of 14 and D period of 3. The Slow Stochastic tries to predict the market direction further out than just one day.
Relative Strength Index: The RSI signal is rising and no longer oversold.
- Settings: The relative strength index is set for a period of 5 which gives it 5 days of market movement to monitor. It is often the first indicator to show an overbought or oversold signal.
Rate of Change: The rate of change signal is rising.
- Settings: Rate Of Change is set for a 21 period. This indicator looks back 21 days and compares price action from the past to the present. With the Rate Of Change, prices are rising when signals are positive. Conversely, prices are falling when signals are negative. As an advance rises the Rate Of Change signal should also rise higher, otherwise the rally is suspect. A decline should see the Rate Of Change fall into negative signals. The more negative the signals the stronger the decline.
Support and Resistance Levels To Be Aware Of:
4550 is light resistance
4525 is light resistance
4500 is resistance
4490 is light resistance
4475 is light resistance
4450 is light resistance
4400 is resistance
4370 is light support
4350 is light resistance
4300 is light resistance
4290 is light resistance
4270 is light resistance
4250 was good support
4225 was light support
4200 is good support
4150 is good support
4100 is light support
4050 is light support
4025 is light support
4000 is good support
Stock Market Outlook for Tomorrow – Thu May 5 2022
For Thursday the morning should see some selling after the huge afternoon rally on Wednesday. Any selling though is an opportunity to setup trades as there is still more upside in the technical signals.
The index roared higher on Wednesday afternoon and pushed through three light resistance levels. Normally we can expect some testing of at least a couple of these levels. That would be 4300 and the 4290 or 4270 valuations.
Overall on Thursday investors should be aware of dips and profit-taking but also prepare for Friday’s April unemployment report. The close on Thursday should be higher ahead of the unemployment report due out Friday morning at 8:30.
Potential Market Moving Events
Thursday:
8:30 Initial jobless claims and continuing jobless claims
8:30 Productivity and Unit Labor Costs (should give further evidence on inflation’s impact)
Friday:
8:30 April nonfarm payrolls and unemployment rate
8:30 Average hourly earnings (another inflation indicator)
8:30 Labor force participation rate
Stock Market Outlook Archives
Morning Investing Strategy Notes for Fri Mar 7 2025

Stock Market Outlook for Fri Mar 7 2025 – All About The February Jobs Numbers

Morning Investing Strategy Notes for Thu Mar 6 2025

Stock Market Outlook for Thu Mar 6 2025 – Volatile But Still Bullish

Morning Investing Strategy Notes for Wed Mar 5 2025

Stock Market Outlook for Wed Mar 5 2025 – Trump Bump?

Morning Investing Strategy Notes for Tue Mar 4 2025

Stock Market Outlook for Tue Mar 4 2025 – Sell-Off Continues – Possible Bounce Today But Lower

Morning Investing Strategy Notes for Mon Mar 3 2025

Stock Market Outlook for Mon Mar 3 2025 – Choppy With Higher Close

Morning Investing Strategy Notes for Fri Feb 28 2025

Stock Market Outlook for Fri Feb 28 2025 – Deeply Oversold But Still Bearish

Morning Investing Strategy Notes for Thu Feb 27 2025
Stock Market Outlook for Thu Feb 27 2025 – Second Bounce Attempt Likely

Morning Investing Strategy Notes for Wed Feb 26 2025

Stock Market Outlook for Wed Feb 26 2025 – Bounce Likely Ahead of NVIDIA Earnings

Morning Investing Strategy Notes for Tue Feb 25 2025
Stock Market Outlook for Tue Feb 25 2025 – Confirmed MACD Down Signal

Morning Investing Strategy Notes for Mon Feb 24 2025
