
Wednesday finally saw the rally run into sellers. The S&P spent the day drifting lower right from the open until by 3:25 with the index down at 4581, buyers returned and pushed the index back above 4600. The loss was small at 29 points with a close at 4602. On Thursday more inflation numbers are released and that may impact the market direction ahead of Friday’s March unemployment numbers.
The NASDAQ lost 177 points to close down 1.2% to 14442 but still above the 200 day moving average. That may chance on Thursday with a potential close below the 200 day.
Let’s review the closing technical indicators from Wednesday on the S&P to see what to expect for Thursday.
Stock Market Outlook Chart Comments At The Close on Wed Mar 30 2022
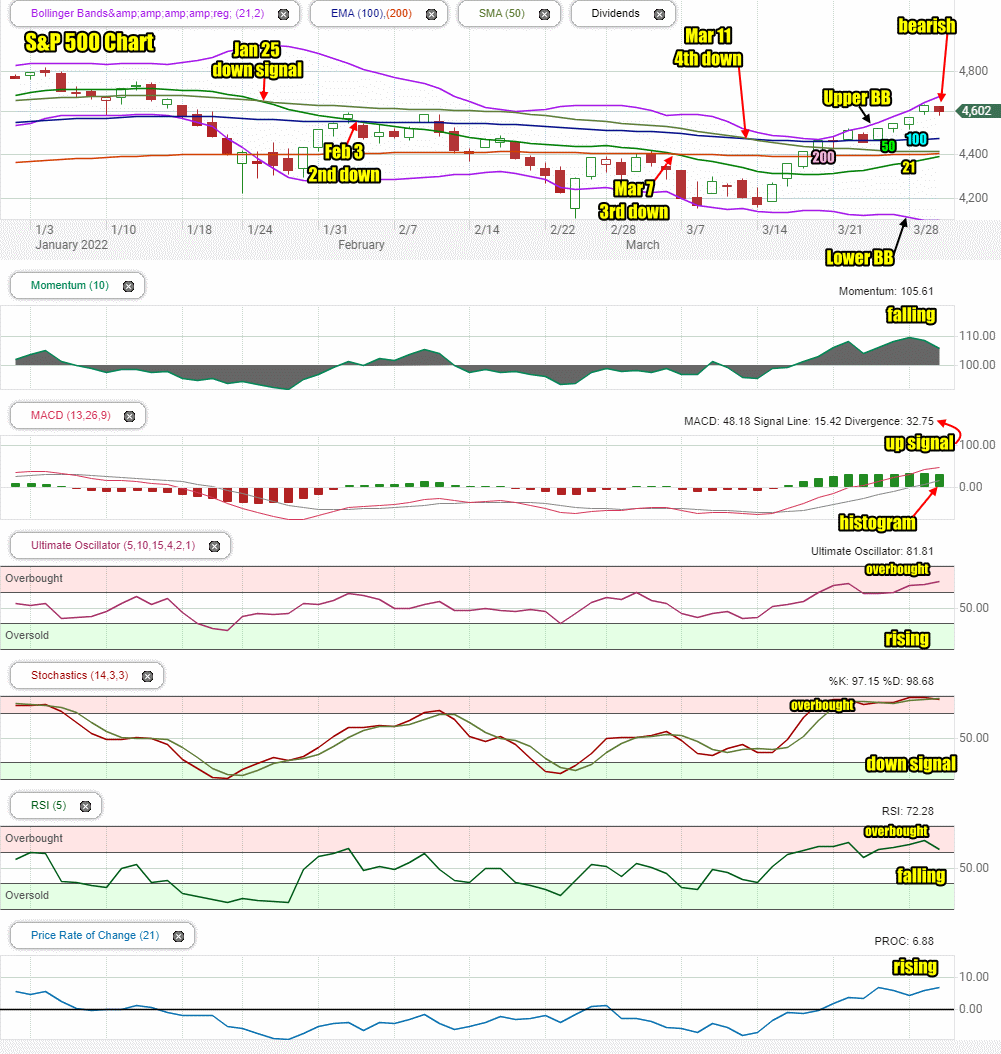
The SPX index closed down at the 4600 level with a slight loss of 29 points on Wednesday. This did not change any of the signals, yet.
The Upper Bollinger Band is still rising being pressured by the rising index. The index closed above all major moving averages for the fifth straight day.
The Upper Bollinger Band is still moving higher and the Lower Bollinger Band is turning lower. Both are bullish signals.
The closing candlestick on Wednesday is bearish and is signaling that a bounce may occur Thursday morning but the market is still overbought and the index has a chance of a second negative close on Thursday.
The 21 day moving average is moving higher which is bullish. The 200 day moving average is also back at the 4400 level which is bullish. If the index continues to stay above the moving averages, the 50 day moving average will not fall below the 200 day but instead will climb higher. This would be a major up signal if the 50 day were to cross above the 100 day this week. The 100 day moving average has not fallen further but is trending sideways. These are bullish signs.
The SPX still has 4 down signals in place but if the 21 day crosses above the 200 day it will be a major up signal supporting the bulls.
The chart is a bit bearish for Thursday. The signals indicate the rally has slowed and stocks in general, are overbought. The chart shows there is a strong possibility of another negative close.
Stock Market Outlook review of Wed Mar 30 2022
Stock Market Outlook: Technical Indicators Review:
Momentum: Momentum is falling and positive. Momentum dipped back on Wednesday for a second day of declines.
- Settings: For momentum I use a 10 period when studying market direction.
MACD Histogram: MACD (Moving Averages Convergence / Divergence) issued an up signal Wed Mar 16 2022. On Wednesday both the MACD up signal and the histogram have lower readings than we saw on prior days.
- Settings: For MACD Histogram, I am using the Fast Points set at 13, Slow Points at 26 and Smoothing at 9.
Ultimate Oscillator: The Ultimate Oscillator is rising and overbought signaling a dip is likely.
- Settings: The Ultimate Oscillator settings are: Period 1 is 5, Period 2 is 10, Period 3 is 15, Factor 1 is 4, Factor 2 is 2 and Factor 3 is 1. These are not the default settings but are the settings I use with the S&P 500 chart set for 1 to 3 months.
Slow Stochastic: The Slow Stochastic has a weak down signal in place and is extremely overbought. Signals are at the point where they are so high, another negative day is likely.
Settings: For the Slow Stochastic I use the K period of 14 and D period of 3. The Slow Stochastic tries to predict the market direction further out than just one day.
Relative Strength Index: The RSI signal is falling and signaling overbought.
- Settings: The relative strength index is set for a period of 5 which gives it 5 days of market movement to monitor. It is often the first indicator to show an overbought or oversold signal.
Rate of Change: The rate of change signal is rising which indicates investors should expect wider price movements on Thursday, either up or down.
- Settings: Rate Of Change is set for a 21 period. This indicator looks back 21 days and compares price action from the past to the present. With the Rate Of Change, prices are rising when signals are positive. Conversely, prices are falling when signals are negative. As an advance rises the Rate Of Change signal should also rise higher, otherwise the rally is suspect. A decline should see the Rate Of Change fall into negative signals. The more negative the signals the stronger the decline.
Support and Resistance Levels To Be Aware Of:
4650 is resistance
4640 is resistance
4625 is resistance
4600 is strong resistance
4590 is resistance
4575 is light support
4560 is support
4550 is light support
4525 is light support
4500 is support
4490 is light support
4475 is light support
4450 is light support
4400 is support
4370 is light support
4350 is light support.
4300 is good support
Stock Market Outlook for Tomorrow – Thu Mar 31 2022
For Thursday the index is still dealing with an overbought market. 4600 is strong resistance and it was tested several times on Wednesday and held the market above it by the close.
On Wednesday the ADP number was higher than expected which warns investors that inflation may pick up steam. This may also impact the market on Thursday.
Thursday starts with the continuing jobless claims followed by Core PCE price index signals. If inflation numbers are hotter than expected, the index will move lower.
Overall though the index took the selling in stride ahead of Friday’s unemployment report. All investors knew the market would dip following the terrific rally from the sell-off lows. Thursday will see a mixed day but weakness will last for the day. The close will be lower as investors prepare for Friday’s non-farm payroll numbers.
Potential Market Moving Events
I will keep these comments up this week.
The final week of March has many events that could impact the market. Friday we get the March non-farm payroll and hourly wages report which have often changed the market direction even temporarily. Aside from all the other reports, a number of Fed Presidents are also speaking which probably means a hawkish number of addresses. Each of the Fed speeches could dip the indexes. None of the speeches are expected to be dovish and none are expected to discuss a quarter point rate increase going forward. That means this week we need to take advantage of the speeches to setup trades on dips. Here are the main events for the week that I think could see dips and possibly a few spikes in the markets. Anything that points to a dip in inflation numbers will result in the index rising.
Thursday:
Thursday is initial jobless claims, continuing jobless claims, nominal personal income and consumer spending, PCE price index, Core PCE price index, Real Consumer Spending and the Chicago PMI. No Fed’s speak on Thursday but these are inflation reports which could dip or rally stocks. All of these are before the open except the Chicago PMI.
Following Days:
Friday:
Friday is the big one – the March nonfarm payroll numbers and unemployment rate and average hourly earnings. This is often a market moving event which can last a week or longer. I will be putting together a SPY ETF trade on Thursday ahead of those numbers and posting it for Members. I will post the outline being considered in Thursday’s morning Investing Strategy Notes before markets open on Thursday.
On Friday at 9:05 Chicago Fed President Evans is speaking before markets open. At 9:45 we get the Market Manufacturing PMI. At 10:00 we get the ISM manufacturing index and construction spending. At no set time in the morning we should get motor vehicle sales which are estimated to reach 14.1 million. This could be a bullish signal but the big one is the March unemployment report. It will overshadow all the other Friday reports.
Stock Market Outlook Archives

Morning Investing Strategy Notes for Fri Apr 11 2025

Stock Market Outlook for Fri Apr 11 2025 – Bounce Likely But Highly Suspect

Morning Investing Strategy Notes for Thu Apr 10 2025

Stock Market Outlook for Thu Apr 10 2025 – Choppy Day With Dips Likely But Higher Close

Morning Investing Strategy Notes for Wed Apr 9 2025

Stock Market Outlook for Wed Apr 9 2025 – Bearish Bounce – Panic and Lower

Morning Investing Strategy Notes for Tue Apr 8 2025

Stock Market Outlook for Tue Apr 8 2025 – Bounce Likely But Highly Suspect

Morning Investing Strategy Notes for Mon Apr 7 2025

Stock Market Outlook for Mon Apr 7 2025 – Bounce Possible At Any Time But Still Bearish and Lower For Now

Morning Investing Strategy Notes for Fri Apr 4 2025

Stock Market Outlook for Fri Apr 4 2025 – All About The March Jobs Numbers

Morning Investing Strategy Notes for Thu Apr 3 2025

Stock Market Outlook for Thu Apr 3 2025 – Bearish Following Higher Than Expected Tariffs

Morning Investing Strategy Notes for Wed Apr 2 2025
Stock Market Outlook for Wed Apr 2 2025 – Tariffs Day – Still Bearish – Bounce Attempt Likely

Morning Investing Strategy Notes for Tue Apr 1 2025

Stock Market Outlook for Tue Apr 1 2025 – Nice Bounce But Still Bearish

Morning Investing Strategy Notes for Mon Mar 31 2025

