Wednesday was all about the Fed and the three quarter point interest rate increase. With investors split on half a point versus three quarter point rate increase, the reaction took some time after 2:00 PM for stocks to rally higher.
By the close investors were of the opinion that the Fed had acted properly and they were back buying stocks.
The S&P ended the day up 54 points to close at 3789.99 and the NASDAQ rose 2.5% for a 270 point gain and a close at 11,099.16.
Let’s review Wednesday’s closing technical indicators to see if the rally can continue into Thursday.
Stock Market Outlook Chart Comments At The Close on Wed Jun 15 2022
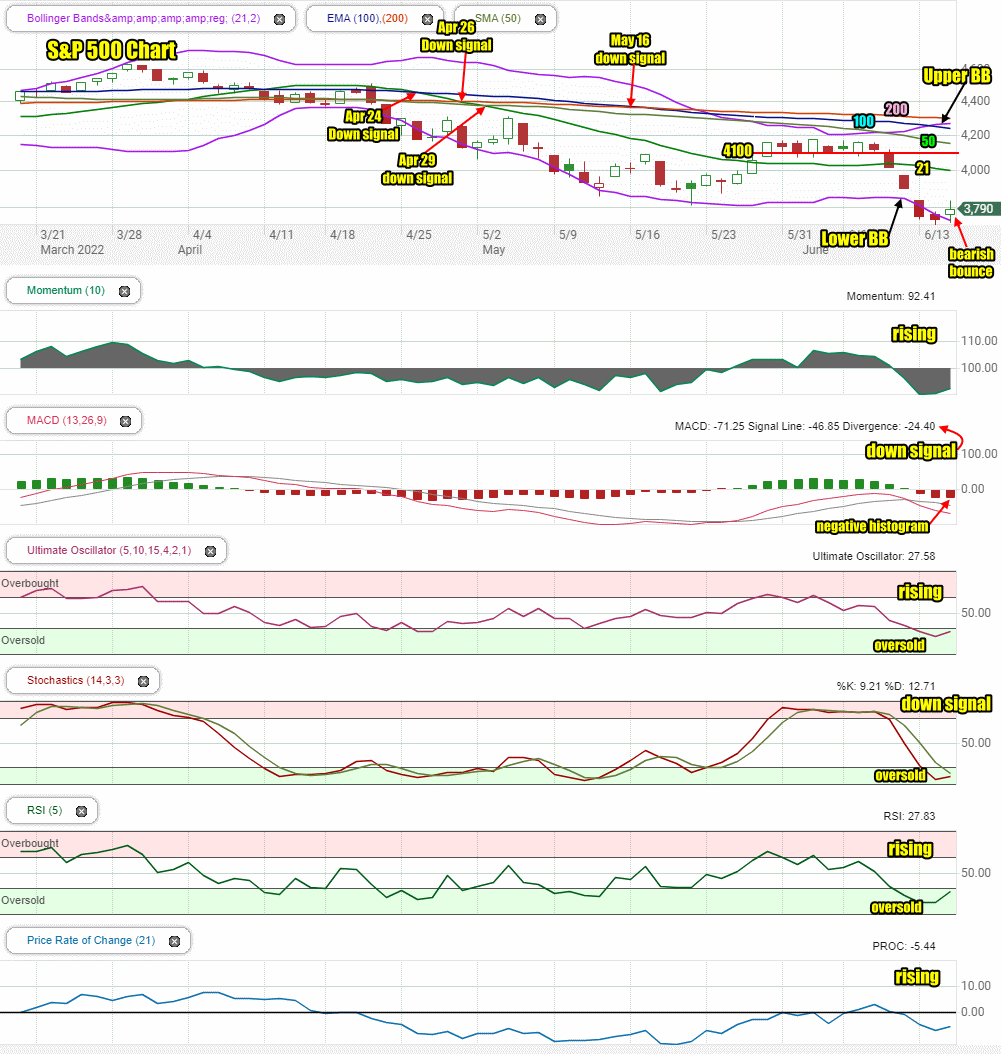
On Wednesday the closing candlestick is pointing to a bearish bounce. The close is also below the 21 day moving average for the fifth day which is bearish.
The Upper Bollinger Band is climbing higher and the Lower Bollinger Band is falling. Usually this indicates a bounce should be expected.
Any bounce though has to recover above 4100 if it is to turn into a rally and not just a bounce. That is unlikely which is why the outlook remains lower after the bounce ends.
The 200, 100 and 50 and 21 day moving averages are all falling lower and the 200 day is leading the market lower. This is bearish. The 21 day is ready to fall below 4000 which is bearish.
There are 4 down signals still in place and there have been no up signals since the start of April. The Fed decision to increase the funds rate three-quarters of a point may be enough to push the index higher on Thursday but the S&P chart is extremely bearish. Any bounce on Thursday the S&P chart is advising will not last.
The chart is 85% bearish for Thursday but a bounce is expected.
Stock Market Outlook review of Wed Jun 15 2022
Stock Market Outlook: Technical Indicators Review:
Momentum: Momentum is rising and negative.
- Settings: For momentum I use a 10 period when studying market direction.
MACD Histogram: MACD (Moving Averages Convergence / Divergence) issued a down signal on Monday June13. On Wednesday the down signal remained very strong. The MACD histogram is also very negative.
- Settings: For MACD Histogram, I am using the Fast Points set at 13, Slow Points at 26 and Smoothing at 9.
Ultimate Oscillator: The Ultimate Oscillator is rising but negative. It is oversold.
- Settings: The Ultimate Oscillator settings are: Period 1 is 5, Period 2 is 10, Period 3 is 15, Factor 1 is 4, Factor 2 is 2 and Factor 3 is 1. These are not the default settings but are the settings I use with the S&P 500 chart set for 1 to 3 months.
Slow Stochastic: The Slow Stochastic has a down signal in place and is oversold. It is ready to move higher.
Settings: For the Slow Stochastic I use the K period of 14 and D period of 3. The Slow Stochastic tries to predict the market direction further out than just one day.
Relative Strength Index: The RSI signal is rising and oversold.
- Settings: The relative strength index is set for a period of 5 which gives it 5 days of market movement to monitor. It is often the first indicator to show an overbought or oversold signal.
Rate of Change: The rate of change signal is rising.
- Settings: Rate Of Change is set for a 21 period. This indicator looks back 21 days and compares price action from the past to the present. With the Rate Of Change, prices are rising when signals are positive. Conversely, prices are falling when signals are negative. As an advance rises the Rate Of Change signal should also rise higher, otherwise the rally is suspect. A decline should see the Rate Of Change fall into negative signals. The more negative the signals the stronger the decline.
Support and Resistance Levels To Be Aware Of:
4200 is light resistance
4150 is light resistance
4100 is light resistance
4050 is light resistance
4025 is light resistance
4000 is strong resistance
3975 is light support and is a decline of 17.5%
3900 is good support and is a decline of 19%
3850 is good support and is a decline of 20%
3825 is light support
3800 is good support.
3775 is light support
3750 is light support
3730 is light support
3700 is good support
3675 is light support
3650 is light support
3625 is light support
3600 is good support and is a decline of 25%
Stock Market Outlook for Tomorrow – Thu Jun 16 2022
For Thursday the Fed’s interest rate hike may be enough to bounce the market. The technical indicators and the closing candlestick on Wednesday all point to a potential bounce.
The morning open may be higher and then see a dip but the start of the noon hour should see the S&P higher. The afternoon will see some selling but a positive close is likely.
With this interest rate hike over and the next one not until July, investors and analysts will probably begin to focus on expectations for a recession. That will probably be the next catalyst to push stocks to move lower. This could start as soon as Friday. For Thursday though, I am taking profits on positions and raising capital for the next dip lower. If inflation signals begin to slow or even fall over the next several weeks, the indexes will rally, so keep that in mind.
For Thursday the technical indicators are quite negative but are trying to turn higher. That should be enough to support the expected bounce, at least for much of Thursday.
Potential Market Moving Events
On Thursday we get the Weekly Initial Unemployment Insurance Claims and housing starts. These may help swing the market higher depending on the numbers.
Wednesday:
8:30 Retail sales were lower by negative 0.3% which was below forecasts of 1%.
8:30 Empire State manufacturing index was minus 1.2 slightly below forecasts.
10:00 NAHB home builder index was 67, in-line with expectations and not signaling a large slow-down.
10:00 Business Inventories were 1.2%, half of the prior 2.4% but not negative.
2:00 FOMC statement – rate is 1.5% to 1.75%.
2:00 Fed Chair Powell news conference
Thursday:
8:30 Weekly Initial Unemployment Insurance Claims
8:30 Housing Starts
8:30 Philadelphia Fed manufacturing index
Friday:
10:00 Leading economic indicators
Stock Market Outlook Archives
Morning Investing Strategy Notes for Fri Apr 11 2025
Stock Market Outlook for Fri Apr 11 2025 – Bounce Likely But Highly Suspect

Morning Investing Strategy Notes for Thu Apr 10 2025
Stock Market Outlook for Thu Apr 10 2025 – Choppy Day With Dips Likely But Higher Close

Morning Investing Strategy Notes for Wed Apr 9 2025
Stock Market Outlook for Wed Apr 9 2025 – Bearish Bounce – Panic and Lower

Morning Investing Strategy Notes for Tue Apr 8 2025

Stock Market Outlook for Tue Apr 8 2025 – Bounce Likely But Highly Suspect

Morning Investing Strategy Notes for Mon Apr 7 2025
Stock Market Outlook for Mon Apr 7 2025 – Bounce Possible At Any Time But Still Bearish and Lower For Now

Morning Investing Strategy Notes for Fri Apr 4 2025

Stock Market Outlook for Fri Apr 4 2025 – All About The March Jobs Numbers

Morning Investing Strategy Notes for Thu Apr 3 2025

Stock Market Outlook for Thu Apr 3 2025 – Bearish Following Higher Than Expected Tariffs

Morning Investing Strategy Notes for Wed Apr 2 2025
Stock Market Outlook for Wed Apr 2 2025 – Tariffs Day – Still Bearish – Bounce Attempt Likely

Morning Investing Strategy Notes for Tue Apr 1 2025
Stock Market Outlook for Tue Apr 1 2025 – Nice Bounce But Still Bearish

Morning Investing Strategy Notes for Mon Mar 31 2025

