Wednesday saw markets move lower again as the Ukraine-Russia crisis took center stage. A mid-morning rally was cut short as reports of Russian troop movements and preparation for a full invasion shook nervous investors. Ukraine called up military reservists and announced they are prepared for an imminent attack by Russia. The S&P was down 79 points to end the day at 4225.50 just a few points above the intraday Jan 24 low of 4222. Many analysts called this a retest but indications are investors are more nervous about the possibility of war than of inflation and the Fed. Thursday th like it will continue lower.
The NASDAQ closed down 344 points at 13037 and ready to fall below 13,000. This is the lowest level of the correction.
Let’s review Wednesday’s close to see what Thursday’s trading will look like.
Stock Market Outlook Chart Comments At The Close on Wed Feb 23 2022
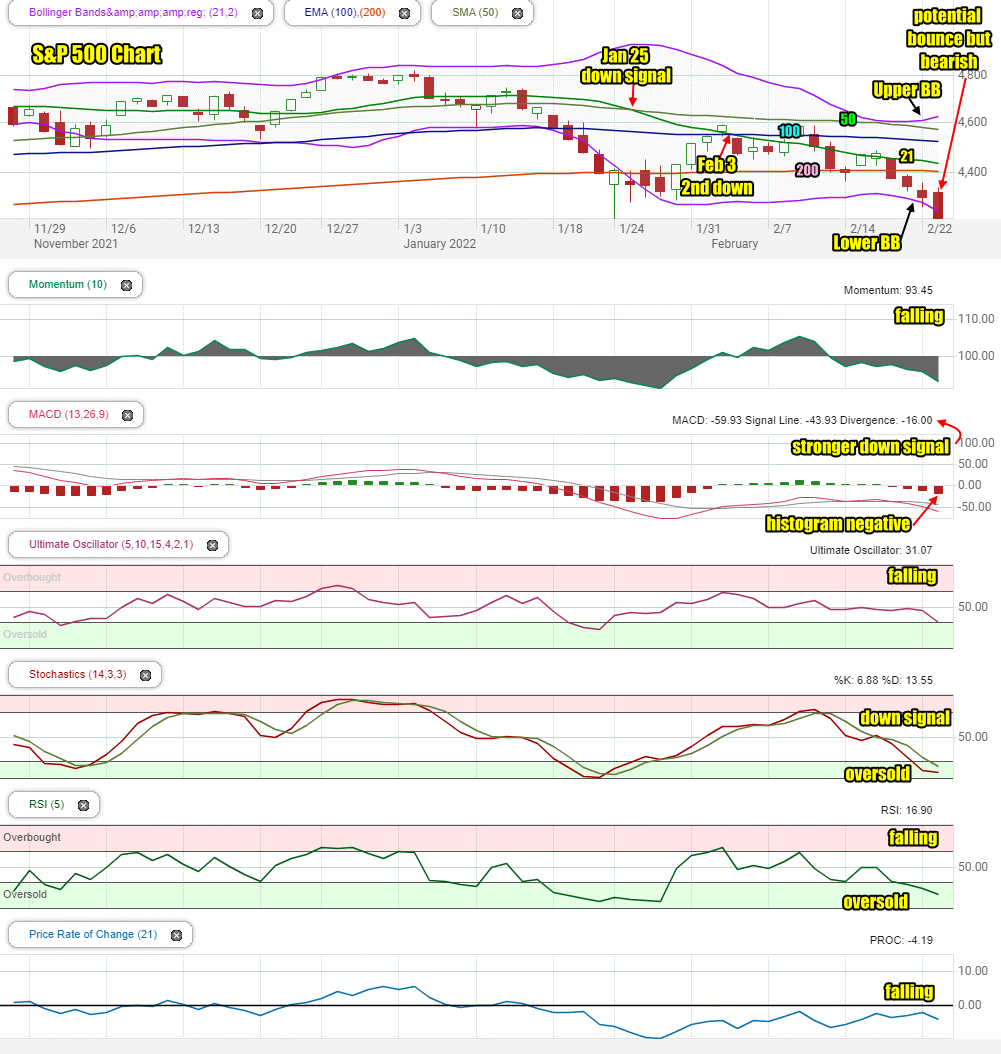
The S&P chart is definitely ugly as of the close on Wednesday. The closing candlestick ended the day below the Lower Bollinger Band which signals oversold and a potential bounce but with more news out of Ukraine pointing to no resolution and a probable invasion by Russia, the candlestick below the Lower Bollinger Band signals more selling ahead.
The Upper Bollinger Band continues to rise and the Lower Bollinger Band is falling. Both are bearish.
The 21 day moving average on Tuesday is falling quickly toward the 200 day. A move below the 200 day is a third down signal. As well the 50 day is falling rapidly toward the 100 day and may cross it early next week for a fourth down signal.
All the moving averages, including the 200 day are now either moving lower or turning lower. None are signaling up.
The 50 and 100 day moving averages are falling which is bearish however the 200 day moving average is hanging on which is bullish.
The chart has two down signals in place and the likelihood of two more coming shortly. One as soon as Friday.
The chart is very bearish. It still looks set to send the index below the lows from late January, down to the 4200 level or, watching the futures Wednesday evening, we could see the index break below 4150 on Thursday.
An invasion of Ukraine with the index this low probably means an easy fall to 4000 or 3950.
The SPX chart is very bearish and investors should stay cautious.
Stock Market Outlook review of Wed Feb 23 2022
Stock Market Outlook: Technical Indicators Review:
Momentum: Momentum is negative and falling. It is nearing levels where a bounce could happen at any time.
- Settings: For momentum I use a 10 period when studying market direction.
MACD Histogram: MACD (Moving Averages Convergence / Divergence) issued a confirmed down signal on Thursday Feb 17 2022. On Wednesday the down signal gained more strength. The MACD histogram is very bearish. More downside is predicted.
- Settings: For MACD Histogram, I am using the Fast Points set at 13, Slow Points at 26 and Smoothing at 9.
Ultimate Oscillator: The Ultimate Oscillator is negative and has fallen to oversold readings but there is more room to fall.
- Settings: The Ultimate Oscillator settings are: Period 1 is 5, Period 2 is 10, Period 3 is 15, Factor 1 is 4, Factor 2 is 2 and Factor 3 is 1. These are not the default settings but are the settings I use with the S&P 500 chart set for 1 to 3 months.
Slow Stochastic: The Slow Stochastic has a down signal in place and is oversold. It could bounce at any time.
Settings: For the Slow Stochastic I use the K period of 14 and D period of 3. The Slow Stochastic tries to predict the market direction further out than just one day.
Relative Strength Index: The RSI signal is falling and into oversold readings. A bounce is possible at any time.
- Settings: The relative strength index is set for a period of 5 which gives it 5 days of market movement to monitor. It is often the first indicator to show an overbought or oversold signal.
Rate of Change: The rate of change signal is falling.
- Settings: Rate Of Change is set for a 21 period. This indicator looks back 21 days and compares price action from the past to the present. With the Rate Of Change, prices are rising when signals are positive. Conversely, prices are falling when signals are negative. As an advance rises the Rate Of Change signal should also rise higher, otherwise the rally is suspect. A decline should see the Rate Of Change fall into negative signals. The more negative the signals the stronger the decline.
Support and Resistance Levels To Be Aware Of:
4500 is resistance
4490 is light resistance
4475 is light resistance
4450 is light support
4400 is good support and the 200 day moving average
4370 is light support
4350 is light support
4300 is good support
4290 is light support
4270 is light support
4250 is good support
4225 is light support
4200 is good support
4150 is light support
4000 is good support
Stock Market Outlook for Tomorrow – Thu Feb 24 2022
For Thursday all eyes are on the Ukraine-Russia crisis. It will be the driving force for the market movements on Thursday. The likelihood of a resolution is extremely unlikely based on comments from Putin and movements of Russian troops.
At the open on Thursday I will be buying additional SPY puts for March 4 expiry at the $420 or $415 put strike as it looks likely the index will fall to 4000 or below by Friday. These will be added to the SPY Market Direction Portfolio at the open. Investors following the NASDAQ may want to consider buying some shares of the SQQQ but these need to be traded and not held for days as markets, when they do bounce could be swift and a lot higher. Buyer are interested in snapping up stocks but have stayed on the sidelines for the most part, waiting for clarity from the ongoing crisis and to a lesser extent, the Fed’s next move to combat inflation.
Don’t forget this is the final evening of the President’s Day Membership Sale. This sale ends at midnight today, Feb 23.
For interested investors this is a chance to get a membership at a discount price, to assist navigating what looks like a rough 2022. It’s a chance to see what FullyInformed.com has to offer to profit during 2022 despite the market gyrations. For existing members this is a chance to renew terms from one to twenty-four months. The 24 month special membership won’t be offered again this year. That plan slashes the membership cost by a full 30%, saving $500 and reducing the monthly cost to just $48.66.
Stock Market Outlook Archives

Morning Investing Strategy Notes for Mon Apr 7 2025

Stock Market Outlook for Mon Apr 7 2025 – Bounce Possible At Any Time But Still Bearish and Lower For Now

Morning Investing Strategy Notes for Fri Apr 4 2025

Stock Market Outlook for Fri Apr 4 2025 – All About The March Jobs Numbers

Morning Investing Strategy Notes for Thu Apr 3 2025

Stock Market Outlook for Thu Apr 3 2025 – Bearish Following Higher Than Expected Tariffs

Morning Investing Strategy Notes for Wed Apr 2 2025

Stock Market Outlook for Wed Apr 2 2025 – Tariffs Day – Still Bearish – Bounce Attempt Likely

Morning Investing Strategy Notes for Tue Apr 1 2025

Stock Market Outlook for Tue Apr 1 2025 – Nice Bounce But Still Bearish

Morning Investing Strategy Notes for Mon Mar 31 2025

Stock Market Outlook for Mon Mar 31 2025 – Bounce Attempt Likely But Still Bearish

Morning Investing Strategy Notes for Fri Mar 28 2025

Stock Market Outlook for Fri Mar 28 2025 – Weakness Into The Weekend

Morning Investing Strategy Notes for Thu Mar 27 2025

Stock Market Outlook for Thu Mar 27 2025 – Bounce Attempt

Morning Investing Strategy Notes for Wed Mar 26 2025

Stock Market Outlook for Wed Mar 26 2025 – A Little Weakness But Still Higher

Morning Investing Strategy Notes for Tue Mar 25 2025
