 Prior Trading Day Summary:
On Wed Feb 19 2025 the indexes squeezed out another small gain but the technical indicators are advising that the indexes are overbought.
The SPX rose 14 points, matching Tuesday’s gain to close at a new all-time closing high of 6144. Volume was 4.6 billion shares, 200 million shares less than Tuesday’s trading. 55% of all stocks were falling by the close.
The NASDAQ closed up 15 points, also matching yesterday’s gain to close at 20,056. Volume was lower by 600 million shares, at 8.4 billion and 52% of all stocks were falling by the close.
Let’s review the technical indicators from Tue Feb 18 2025 to see what to expect for Thu Feb 20 2025.
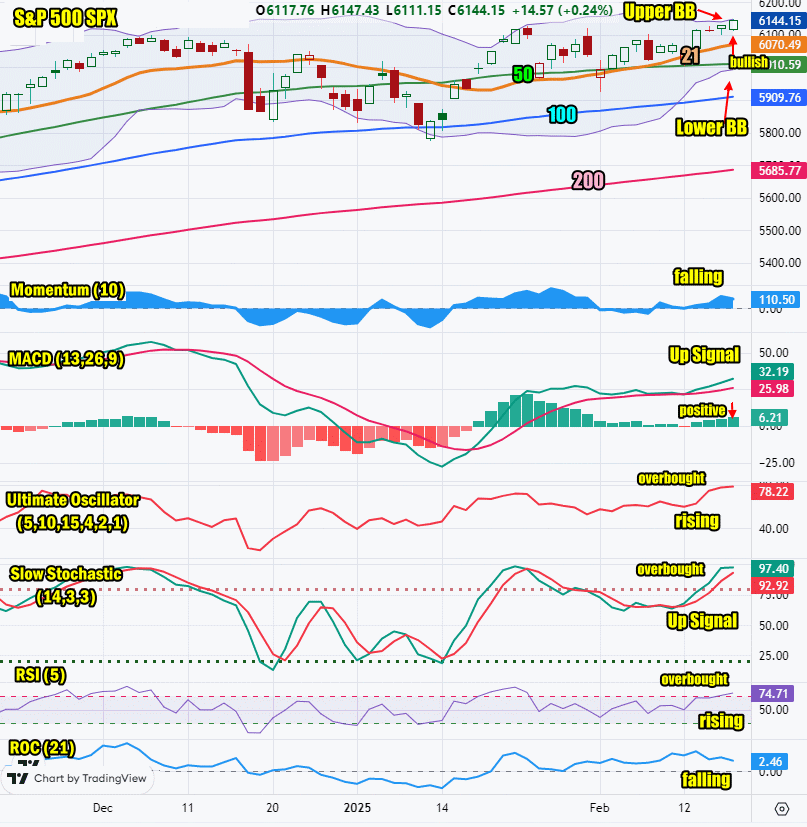
Stock Market Outlook: SPX Closing Chart For Wed Feb 19 2025
The index closed above all moving averages and at the Upper Bollinger Band. This is very bullish.
The closing candlestick is signaling overbought and a potential lower close.
The 21 day moving average is rising and closed at 6070 which is bullish.
The 50 day moving average is rising and closed at 6010 which is bullish.
The 100 day moving average is rising and closed at 5909 which is bullish.
The 200 day moving average is rising and closed at 5685 which is bullish.
The Lower Bollinger Band is rising which is bullish. The Upper Bollinger Band is trending sideways. A Bollinger Bands Squeeze is underway to start the week. There is a good chance the squeeze will end with stocks climbing.
For Thursday the SPX chart is bullish with an overbought warning from the closing candlestick.

SPX Stock Market Outlook review of Wed Feb 19 2025
Stock Market Outlook: Technical Indicators Review
Momentum: Momentum is falling and positive..
|
MACD Histogram: MACD (Moving Averages Convergence / Divergence) issued an up signal on Fri Jan 17 2025. The up signal gained strength on Wed Feb 19 2025.
|
Ultimate Oscillator: The Ultimate Oscillator is rising sharply and is overbought.
|
Slow Stochastic: The Slow Stochastic has an up signal in place and is overbought. The signal looks ready to dip.
|
Relative Strength Index: The RSI signal is rising and overbought.
|
Rate of Change: The rate of change signal is falling, signaling Thursday will end lower.
|
Stock Market Outlook: Support and Resistance Levels |
| 6150 is resistance |
| 6125 is resistance |
| 6100 is resistance |
| 6090 is resistance |
| 6070 is resistance |
| 6050 is resistance |
| 6025 is resistance |
| 6015 is resistance |
| 6000 is support |
| 5990 is support |
| 5970 is support |
| 5950 is support |
| 5900 is support |
| 5890 is support |
| 5875 is support |
| 5850 is support |
Stock Market Outlook for Thu Feb 20 2025
Housing starts on Wednesday surprised to the downside and housing stocks fell. Meanwhile building permits were unchanged at 1.48 million defying forecasts of a drop. The FOMC minutes were not a surprise on Wednesday and stocks did not react.
For Thursday the technical signals are showing stocks in general are overbought and may be about to rest. Thursday looks like a choppy day lies ahead and there is a chance for a lower or flat close.
Potential Economic and Political Market Moving Events
Monday:
No events
Tuesday:
8:30 Empire State manufacturing survey was much higher than estimated at 5.7
10:00 Home builder confidence index fell more than expected to 42
Wednesday:
8:30 Housing starts for Jan were lower at 1.37 million, well below estimates.
8:30 Building permits rose more than expected to 1.48 million
2:00 Minutes of Fed January FOMC meeting are not expected to make any difference to market direction today
Thursday:
8:30 Weekly Initial Unemployment Insurance Claims are estimated to rise by 2,000 to 215,000
8:30 Philadelphia Fed manufacturing survey is expected to drop to 13.2 from 44.3 prior
10:00 US leading economic indicators are expected to slip to -0.2% from -0.1% prior
