
 Prior Trading Day Summary:
 Prior Trading Day Summary:
On Wed Apr 2 2025, investors rallied stocks for a third day on hope that the tariffs being introduced would be lower than many expected. As we found out after the market closed, the tariffs were higher and many analysts believe they could commence trade wars. Futures early morning on Thursday showed a steep decline to start the day.
The SPX closed up 38 points to 5670 on 4.3 billion shares traded. For the week the SPX is up 90 points. If the futures hold for Thursday, a drop of 125 points would be a dip of 35 points on the week with the SPX down around 5575.
The NASDAQ closed up 151 points ending the day at 17,601 on 9.8 billion shares traded. New lows were still very high at 301. For the week, the NASDAQ is up 278 points. The futures show the NASDAQ could open down 660 points or just below 17000.
With stocks set to probably have a rough day, to put it mildly, let’s review the SPX technical indicators at the close on Wed Apr 2 2025 to see if stocks can bounce if they open deeply lower.
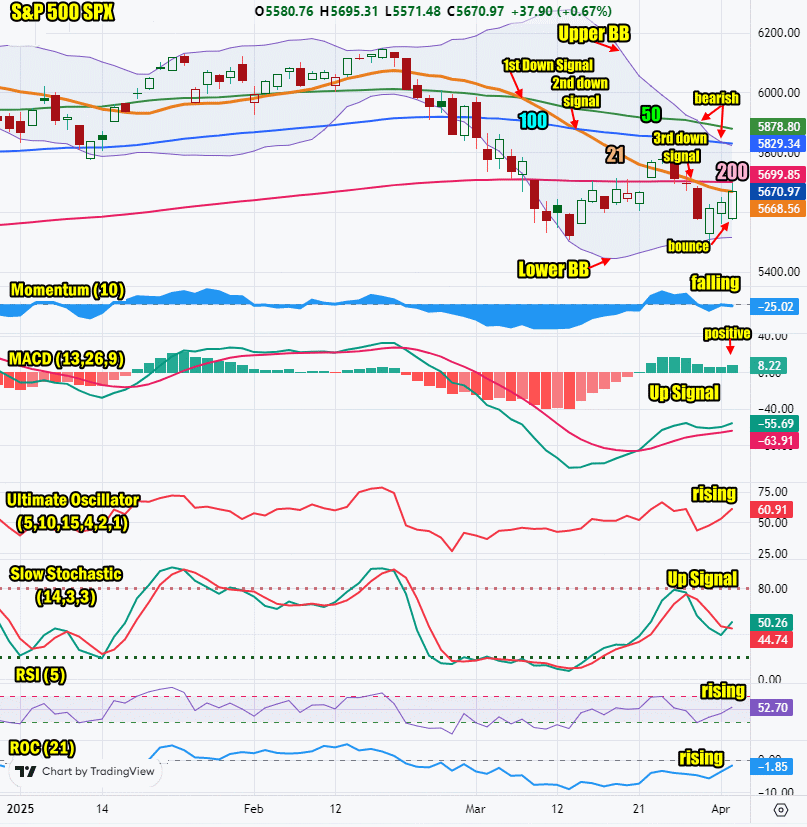
Stock Market Outlook: SPX Closing Chart For Wed Apr 2 2025
The index closed below the 200 day moving average. This is bearish.
The closing candlestick left behind along shadow which usually suggests a drop in the SPX is likely.
The 21 day moving average is falling and closed at 5668 which is bearish. The 21 day moving average fell below the 50 day on Friday Mar 7/ It fell below the 100 day on Thursday Mar 13 for a second down signal and on Friday Mar 28 it fell below the 200 day for a third down signal.
The 50 day moving average is falling and closed at 5878 which is bearish.
The 100 day moving average is falling and closed at 5829 which is bearish.
The 200 day moving average is unchanged and closed at 5700 which is bearish.
The Lower Bollinger Band is turning sideways which could be signaling, a down move is coming. The Upper Bollinger Band is falling below the 50 day moving average and 100 day. This is bearish and a potential Bollinger Bands Squeeze now looks negative.
For Thursday the SPX chart is still strongly bearish and the closing candlestick warns that stocks will fall again on Thursday.
SPX Stock Market Outlook review of Wed Apr 2 2025
Stock Market Outlook: Technical Indicators Review
Momentum: Momentum is falling and negative.
|
MACD Histogram: MACD (Moving Averages Convergence / Divergence) issued an up signal on Friday Mar 21 2025. The up signal gained a bit of strength on Wed Apr 2 2025 but still looks ready to turn negative.
|
Ultimate Oscillator: The Ultimate Oscillator is rising and positive.
|
Slow Stochastic: The Slow Stochastic has an up signal in place.
|
Relative Strength Index: The RSI signal is rising.
|
| Rate of Change: The rate of change signal is rising signaling a higher close is expected. Settings: Rate Of Change is set for a 21 period. This indicator looks back 21 days and compares price action from the past to the present. With the Rate Of Change, prices are rising when signals are positive. Conversely, prices are falling when signals are negative. As an advance rises, the Rate Of Change signal should also rise higher, otherwise the rally is suspect. A decline should see the Rate Of Change fall into negative signals. The more negative the signals the stronger the decline. |
Stock Market Outlook: Support and Resistance Levels |
| 6000 is resistance |
| 5970 is resistance |
| 5950 is resistance |
| 5900 is resistance |
| 5890 is resistance |
| 5875 is resistance |
| 5850 is resistance |
| 5800 is resistance |
| 5775 is resistance |
| 5750 is resistance |
| 5730 is resistance |
| 5700 is resistance |
| 5650 is support |
| 5630 is support |
| 5600 is support |
| 5585 is support |
| 5550 is support |
| 5500 is support |
| 5450 is support |
Stock Market Outlook for Thu Apr 3 2025
With the news of the Trump tariffs stock markets around the world are declining as investors try to grasp what the tariffs will mean for their respective economies. Some countries announced retaliation is likely, such as China, Taiwan and Canada whereas other countries indicated they will seek better terms, such as the EU. The turmoil has the futures showing a steep decline at the open on Thursday for stocks.
The ADP numbers show that the economy is still producing an impressive number of new jobs with 155,000 jobs well ahead of all estimates. This helped spark the rally on Wednesday.
Thursday looks very bearish, but sometimes markets can surprise. While a bounce back to above the 200 day is very unlikely this week, we could still see the indexes close off the early morning lows.
Potential Economic and Political Market Moving Events
Monday:
9:45 Chicago business barometer came in higher than expected at 47.6 which was higher than the prior reading of 45.5
Tuesday:
9:45 Final S&P US manufacturing PMI was much higher than expected at 50.2
10:00 Construction spending rose well beyond estimated to 0.7%
10:00 ISM Manufacturing slipped to 49%
10:00 Job openings came in at 7.6 million, down from 7.7 million.
Through The Day we get auto sales which are estimated to be 16.5 million, up slightly from 26.0 million prior
Wednesday:
8:15 ADP employment surprised with a strong 155,000 jobs
10:00 Factory orders arefell as expected to 0.6% from 1.7% prior
Thursday;
8:30 Weekly Initial Unemployment Insurance Claims claims are estimated at 228,000 up just 4,000
8:30 Trade deficit is estimated to rise slightly to -123.4 billion from -131.4 billion prior
9:45 S&P final services PMI is estimated almost unchanged at 54.2
10:00 ISM services are estimated at 52.9%, down from 53.5% prior