FullyInformed.com

Stock Market Outlook for Thu Apr 11 2024 – Weakness and Lower

Apr 11, 2024 | Stock Market Outlook

Stock Market Outlook Weakness and LowerPrior Trading Day Summary:

On Wednesday the CPI number was higher than estimates. For many analysts it meant that the Fed would probably delay any rate cut longer than expected. Most analysts had picked June as the first rate cut. Now many were talking about September and others about no rate cuts in 2024 at all. That saw stocks spend the day lower. By the close the S&P was down 49 points to $5160 while the NASDAQ fell 136 points to close at 16170.

Let’s review the closing technical indicators on Wed Apr 10 2024 to see what to expect for Thu Apr 11 2024.


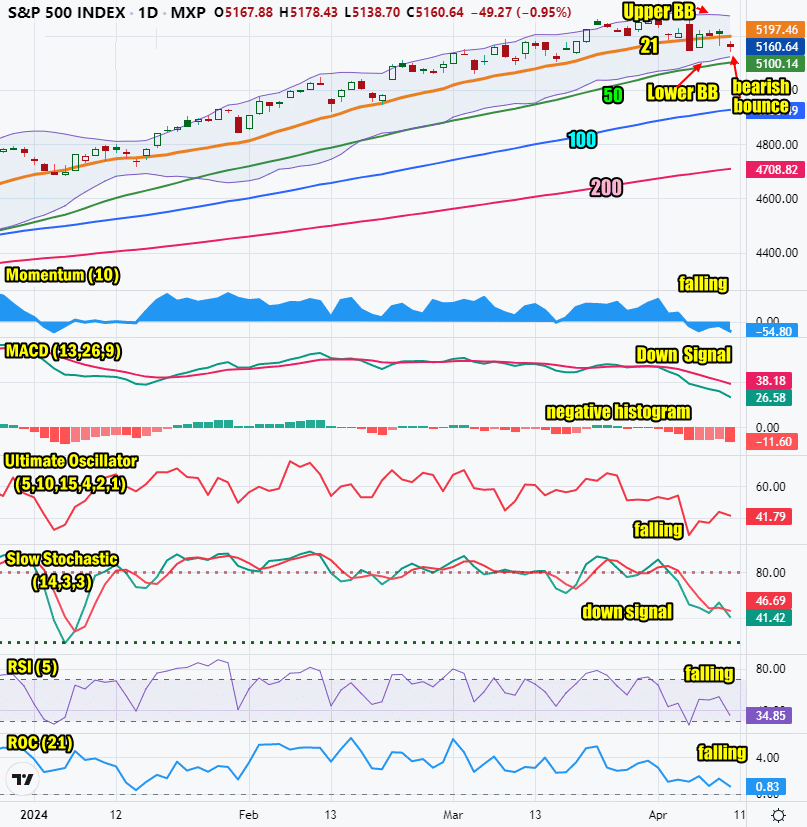
Stock Market Outlook: SPX Closing Chart For Wed Apr 10 2024

The index closed well below the Upper Bollinger Band and below the 21 day moving average. This is bearish to neutral for a second day.

The closing candlestick came close to reaching the Lower Bollinger Band. While bearish, the candlestick is also typical of a bounce attempt for Thusday.

The 21 day moving average is now turning sideways which is bearish.

The 50 day moving average is rising and at 5100, which is bullish.

The 100 and 200 day moving averages are climbing which is bullish. The 200 day is at 4708 on the SPX which is bullish.

The Bollinger Bands are in another Bollinger Bands Squeeze. The Lower Bollinger Band is turning back up while the Upper Bollinger Band is turning lower. A new Bollinger Bands Squeeze is underway and at present the squeeze looks like it will end with stocks moving lower.

The S&P chart is more bearish than bullish for Thursday.

SPX Stock Market Outlook review of Wed Apr 10 2024


Stock Market Outlook: Technical Indicators Review

Momentum: Momentum is falling and negative.

  • Settings: For momentum I use a 10 period when studying market direction.
MACD Histogram: MACD (Moving Averages Convergence / Divergence) issued a down signal on Tue Apr 2. On Wed Apr 10 2024 the down signal was stronger. The MACD histogram is also strongly negative.

  • Settings: For MACD Histogram, I am using the Fast Points set at 13, Slow Points at 26 and Smoothing at 9. 
Ultimate Oscillator: The Ultimate Oscillator is falling.

  • Settings: The Ultimate Oscillator settings are: Period 1 is 5, Period 2 is 10, Period 3 is 15, Factor 1 is 4, Factor 2 is 2 and Factor 3 is 1. These are not the default settings but are the settings I use with the S&P 500 chart set for 1 to 3 months.
Slow Stochastic: The Slow Stochastic has an down signal in place

  • Settings: For the Slow Stochastic I use the K period of 14 and D period of 3. The Slow Stochastic tries to predict the market direction further out than just one day.
Relative Strength Index: The RSI signal is falling and negative. It is nearing oversold readings.

  • Settings: The relative strength index is set for a period of 5 which gives it 5 days of market movement to monitor.  It is often the first indicator to show an overbought or oversold signal.
Rate of Change: The rate of change signal is falling indicating Thursday will end lower. It is nearing oversold levels.

  • Settings: Rate Of Change is set for a 21 period. This indicator looks back 21 days and compares price action from the past to the present. With the Rate Of Change, prices are rising when signals are positive. Conversely, prices are falling when signals are negative. As an advance rises, the Rate Of Change signal should also rise higher, otherwise the rally is suspect. A decline should see the Rate Of Change fall into negative signals. The more negative the signals the stronger the decline.

Stock Market Outlook: Support and Resistance Levels

5275 is resistance
5250 is resistance
5225 is resistance
5200 is resistance
5190 is resistance
5175 is resistance
5150 is resistance
5125 is support
5115 is support
5100 is support
5075 is support
5050 is support
5025 is support
5000 is light support
4990 is light support
4975 is light support
4950 is support


Stock Market Outlook for Thu Apr 11 2024 

The technical indicators are all pointing to a lower day on Thursday. While there is a good chance for a bounce attempt, the technical indicators are advising that any bounce won’t hold on Thursday.

A lower day is expected.

On Thursday before the open investors get the latest Producer Price Index readings. After Wednesday’s CPI being higher than expected, many investors now believe the PPI will also be higher. This will add to selling pressure on Thursday, if the rates are higher than estimated.


Potential Economic and Political Market Moving Events

The major events this week were on Tuesday with the latest PMI numbers being released and the Fed’s Beige Book due out Wednesday at 2:00 PM and PPI on Thursday.

Monday:

No economic reports

Tuesday:

6:00 NFIB optimism index is expected to rise slightly to 89.7 Instead it rose to 88.5%.

Wednesday:

8:30 Consumer price index wasexpected to be lower at 0.3% versus 0.4% prior. Instead it rose to 0.4%.

8:30 Core CPI was estimated to be 0.3% but rose to 0.4%.

8:30 CPI year-over-year was expected to be 3.4%, but rose to 3.5%

8:30 Core CPI year-over-year was estimated to be 3.7% but came in at 3.8%

10:00 Wholesale inventories came in as expected at 0.5%

2:00 Minutes of the March FOMC meeting

2:00 Monthly Federal USA budget is estimated at -$220 billion versus the prior -373 billion.

Thursday:

8:30 Weekly Initial Unemployment Insurance Claims are estimated to be 217,000

8:30 Producer Price Index is estimated to fall to 0.3%

8:30 Core PPI is estimated to fall to 0.2%

8:30 PPI year-over-year is estimated at 1.6%

8:30 Core PPI tear over year is estimated at 2.8%


Search

Select to view all results...

Generic selectors
Exact matches only
Search in title
Search in content
Post Type Selectors

Recent Outlooks

Stock Market Outlook for Thu Jan 2 2025 – Bounce Likely But Bye Bye Santa

Prior Trading Day Summary: The final day of 2024, Tuesday Dec 31, saw more profit-taking and lower closes. The S&P closed down 25 points. As a minimum the Santa Claus Rally needs to gain at least 1% over the close …

Morning Investing Strategy Notes for Tue Dec 31 2024

For FullyInformed Members the morning Investing Strategy Notes for Tue Dec 31 2024 review Monday’s sell-off and the question of whether there is still a chance for the Santa Claus Rally. Stocks discussed include NVIDIA Stock (NVDA), Johnson and Johnson …

Stock Market Outlook for Tue Dec 31 2024 – Possible Bounce But Santa May Be Gone

Prior Trading Day Summary: Thursday saw further selling on New York and the NASDAQ. By the end of the day the S&P had lost 64 points to close at 5906. The NASDAQ closed down 235 points closing at 19486. The …

Morning Investing Strategy Notes for Mon Dec 30 2024

For FullyInformed Members the morning Investing Strategy Notes for Mon Dec 30 2024 review Friday’s sell-off and the outlook for the anticipated Santa Claus Rally. Stocks discussed include Winnebago Industries Stock (WGO), NVIDIA Stock (NVDA), Nucor Stock (NUE) and more …

Stock Market Outlook for Mon Dec 30 2024 – Looking For Santa Claus Rally

Prior Trading Day Summary: Friday was a low volume day on the S&P but not on the NASDAQ where 8 billion shares were traded. Whether the day was primarily profit-taking or computerized trading as the market dipped lower, the close …

Morning Investing Strategy Notes for Fri Dec 27 2024

For FullyInformed Members the morning Investing Strategy Notes for Fri Dec 27 2024 review the market action on Thursday. Stocks discussed include Advanced Micro Devices Stock (AMD), Apple Stock (AAPL), IWM ETF, VIX Index and more. The morning Investing Strategy …

Stock Market Outlook for Fri Dec 27 2024 – Still Bullish

Prior Trading Day Summary: Thursday was a low volume day as anticipated and stock indexes were basically flat on the day. The S&P closed down 2 points to 6037 and the NASDAQ was down 10 points to 20020. There was …

Morning Investing Strategy Notes for Thu Dec 26 2024

For FullyInformed Members the morning Investing Strategy Notes for Thu Dec 26 2024 review the rally on Tuesday and the outlook for the so-called Santa Claus Rally. Stocks discussed include UnitedHealth Group Stock (UNH), Apple Stock (AAPL) and more. The …

Stock Market Outlook for Thu Dec 26 2024 – Continuing To Run Higher

Prior Trading Day Summary: Tuesday saw a low volume half day. Normally a half day favors the bulls and Tuesday definitely proved this point. The SPX rose 66 points to end the day at 6040. The past three trading days …

Morning Investing Strategy Notes for Tue Dec 24 2024

For FullyInformed Members the morning Investing Strategy Notes for Tue Dec 24 2024 review the bounce on Monday as well as Tuesday’s half day of trading and what to expect for Thursday and possibly Friday. Stocks discussed include Nike Stock …

Stock Market Outlook for Tue Dec 24 2024 – Weakness With Possible Dip But Still Bias Up

Prior Trading Day Summary: Monday saw investors try to resume the bounce from Friday. The day started with a dip which was expected. The dip brought in buyers and the rally restarted. By the close the SPX had climbed 43 …

Morning Investing Strategy Notes for Mon Dec 23 2024

For FullyInformed Members the morning Investing Strategy Notes for Mon Dec 23 2024 review the bounce on Friday along with the outlook for the shortened Christmas Week of trading. Stocks discussed include Nike Stock (NKE), Lululemon Athletica Stock (LULU), FedEx …

Stock Market Outlook for Mon Dec 23 2024 – Possible Dip But Still Bullish and Higher

Prior Trading Day Summary: Friday saw a second bounce in equities following Wednesday’s collapse after the Fed’s news conference made it clear the Fed may scale back interest rate cuts in 2025 to 2 from an expected 4. Friday’s bounce …

Morning Investing Strategy Notes for Fri Dec 20 2024

For FullyInformed Members the morning Investing Strategy Notes for Fri Dec 20 2024 review the failed rally attempt on Thursday and what investors should expect into the end of the week. Stocks discussed include Nike Stock (NKE), FedEx Stock (FDX) …

Subscribe For The Latest News