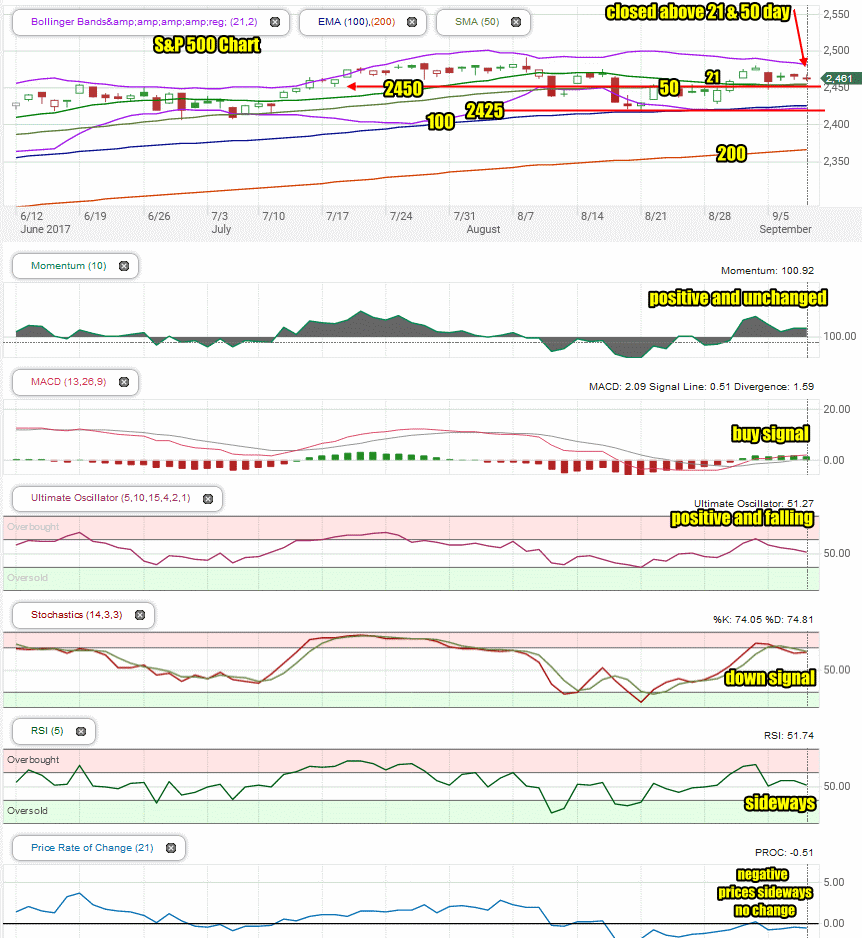
 Friday was a choppy day the ended with the S&P holding slight losses, the Dow a small gain and the NASDAQ seeing the second worst day of losses for the week.
S&P 500 Index Close
The S&P index ended down 3.67 to 2461.43
Dow Jones Index Close
The Dow Jones ended up 13.01 to 21,797.79
NASDAQ Index Close
The NASDAQ closed down 37.68 to 6360.19
Stock Market Outlook

Stock Market Outlook review of Sep 8 2017
Chart Comments At The Close:
The S&P on Friday ended with slight losses but the 50 day moving average is now above the 21 day and continued to move higher on Friday confirming the market sell signal.
The index slipped further on Friday but held above the 50 and 21 day moving average but the Upper Bollinger Band is continuing to fall. The 100 and 200 day moving averages are still climbing.
There are almost as many bearish signals as there are bullish ones coming from the chart on Friday. Overall though, the outlook is still bearish, so Monday becomes important to sent the “mood” for the week.
Stock Market Outlook: Technical Indicators:
Momentum: For momentum I use a 10 period when studying market direction. Momentum is positive but unchanged.
MACD Histogram: For MACD Histogram, I am using the Fast Points set at 13, Slow Points at 26 and Smoothing at 9. MACD (Moving Averages Convergence / Divergence) issued a buy signal on Aug 31. The buy signal continued on Friday.
Ultimate Oscillator: The Ultimate Oscillator settings are: Period 1 is 5, Period 2 is 10, Period 3 is 15, Factor 1 is 4, Factor 2 is 2 and Factor 3 is 1. These are not the default settings but are the settings I use with the S&P 500 chart set for 1 to 3 months. The Ultimate Oscillator is positive and still falling.
Slow Stochastic: For the Slow Stochastic I use the K period of 14 and D period of 3. The Slow Stochastic tries to predict the market direction further out than just one day. The Slow Stochastic has a weak down signal in place for Monday.
Relative Strength Index: The relative strength index is set for a period of 5 which gives it 5 days of market movement to monitor. It often is the first indicator to show an overbought or oversold signal. The RSI signal turned sideways which indicates no major price changes are expected.
Rate of Change: Rate Of Change is set for a 21 period. This indicator looks back 21 days and compares price action from the past to the present. The rate of change signal is negative and moving sideways indicating not much change in prices is expected.
Support Levels To Be Aware Of:
The market has light support at 2450 and good support at 2425. There is also light support at 2400, 2380, 2350 and 2300.
Stock Market Outlook for Tomorrow – Monday Sep 11 2017
Stocks are driven as much by emotion as by fundamentals and last week there was a lot of emotions in the market. Monday we could see the market push higher if the reports of less damage from Hurricane Irma end up being true. Insurance companies and financials were hammered last week in the wake of anticipated fallout from the devastation from Hurricanes Harvey and Irma. If claims are far less than anticipated that could put a floor under the markets for Monday.
Technically there is little change on Friday from Thursday. There is a buy signal from MACD still in place and a sell signal from the Slow Stochastic. Both the Relative Strength Index (RSI) and the Rate Of Change are signaling that they expect very little change. The Ultimate Oscillator is falling while momentum is still positive. Overall then, a mixed outlook from the technical indicators, but all are showing signs of pressure from sellers.
Still, Monday looks better than Friday did as long as the Hurricane loses a lot of its power by Monday morning. I am anticipating some weakness but a general bias to the upside which should give us an “Up Day”.
Stay FullyInformed With Email Updates
Market Direction Internal Links
Profiting From Understanding Market Direction (Articles Index)
Understanding Short-Term Signals
Market Direction Portfolio Trades (Members)
Market Direction External Links
IWM ETF Russell 2000 Fund Info
Market Direction SPY ETF 500 Fund Info
