Prior Trading Day Summary:
Friday saw a fourth straight up day with more talk of a likely half point Fed interest rate cut this week rather than a quarter point.
The SPX rose 30 points on 3.5 billion shares traded to end the week at 5626 just 43 points below the all-time high.
The NASDAQ rose 114 points ending the day at 17684 still almost 1000 points below it’s all-time high of 18,671.
It was the best week for the indexes with the S&P recovering 217 or the 240 point loss from the prior week and the NASDAQ recovering 993 points of the 1023 points lost during the first week of September.
Let’s review the closing technical indicators from Fri Sep 13 2024 to see if the rally can continue into the third week of September.
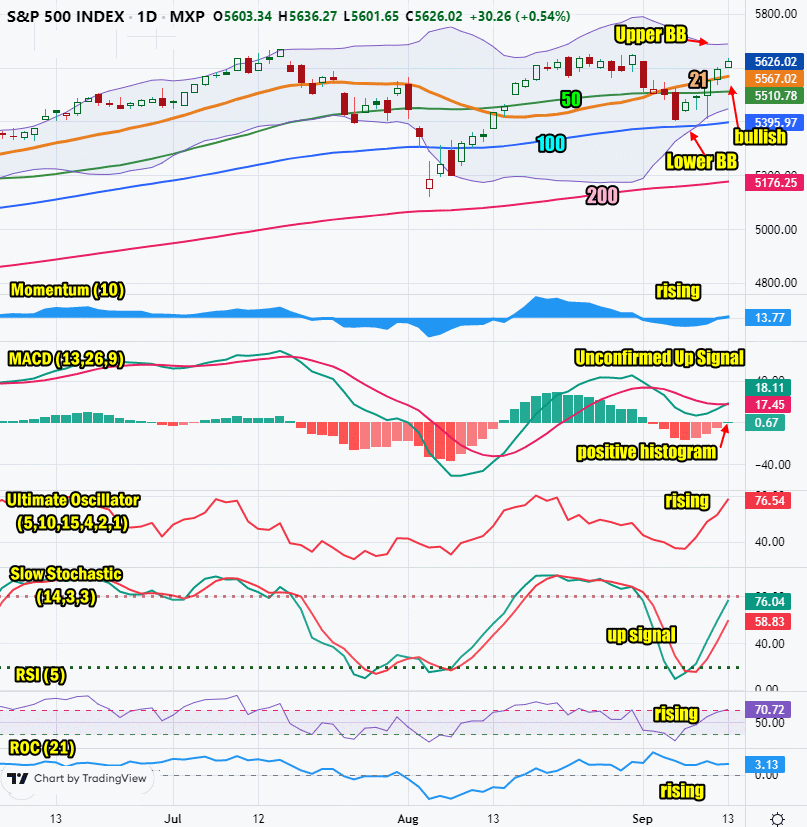
Stock Market Outlook: SPX Closing Chart For Fri Sep 13 2024
The index closed above the 21 day moving average which is bullish.
The closing candlestick has a long shadow which signals a probable lower start to the day on Monday.
The 21 day moving average is higher at 5567. This is bullish.
The 50 day moving average is higher at 5510. This is bullish but the climb in the 100 day has been slowing for the past week.
The 100 day moving average is rising and closed at 5395 which is bullish.
The 200 day moving average is in an uptrend and closed at 5176 which is bullish.
The Lower Bollinger Band is above the 100 day moving average and climbing which is bullish.
The Upper Bollinger Band is unchanged. This is bearish.
The chance of a Bollinger Bands Squeeze this week is high. It’s anyone’s guess which way stocks will head out of the squeeze but at present the daily candlesticks are following the Lower Bollinger Band higher. Often that signals a higher move coming or at the very least, a move higher into the Fed’s interest rate announcement.
The S&P chart is bullish for Monday even if there is a lower open.

SPX Stock Market Outlook review of Fri Sep 13 2024
Stock Market Outlook: Technical Indicators Review
Momentum: Momentum is rising and positive.
|
MACD Histogram: MACD (Moving Averages Convergence / Divergence) issued a down signal on Thu Sep 5 2024. On Friday a weak and unconfirmed up signal was issue and the MACD histogram turned positive.
|
Ultimate Oscillator: The Ultimate Oscillator is rising and positive. It is nearing overbought levels.
|
Slow Stochastic: The Slow Stochastic has an up signal in place. It is nearing overbought levels.
|
Relative Strength Index: The RSI signal is rising and positive. It is nearing overbought levels.
|
Rate of Change: The rate of change signal is rising signaling Monday will end higher.
|
Stock Market Outlook: Support and Resistance Levels |
| 5650 is resistance |
| 5625 is resistance |
| 5615 is resistance |
| 5600 is resistance |
| 5575 is resistance |
| 5550 is resistance |
| 5540 is resistance |
| 5525 is support |
| 5500 is support |
| 5470 is support |
| 5450 is support |
| 5425 is support |
| 5400 is support |
| 5375 is support |
| 5350 is support |
| 5325 is support |
| 5300 is support |
Stock Market Outlook for Mon Sep 16 2024
For Monday the MACD technical indicator has given an unconfirmed up signal. I am expecting it will be confirmed by the end of the day.
The opening could weak and even turn negative but the close is still expected to be positive and higher.
Many of the technical indicators are rising into overbought readings but there is still room to rise before they are fully overbought.
Expect a lower open or dip early morning and a higher close. Markets should move higher into the Fed’s decision on interest rates due out on Wednesday. Don’t be surprised if after the interest rate decision stocks sell lower later in the week as investors digest what the Fed’s interest rate cut is telling investors about the economy. Many analysts believe a half point rate cut advises the Fed is concerned the economy is slowing more than expected. Other believe the Fed should start with a half point cut as they believe the Fed is too late to start cutting rates. Finally there is a third argument that a quarter point cut is more appropriate and signals to the market that the economy is doing fine but the time of high rates is over.
Potential Economic and Political Market Moving Events
Monday:
8:30 Empire State manufacturing survey is expected to come in at -5.0, down from -4.7 prior
