 Prior Trading Day Summary:
On Friday the SPX jumped higher almost 30 points and made it to 5862 by 10:25 but that was the extend of the rally. By the close the SPX was down 2 points closing at 5808. 45% of all stocks were falling by the close. For the week the index lost 56 points. This ended 6 weeks of straight gains for the index.
The NASDAQ rose 103 points to close at 18,518 on 6.2 billion with 65% of all trading volume advancing. The index closed up 29 points for the week. This marked the 7th week of straight gains for the NASDAQ.
Let’s review the technical indicators from Fri Oct 25 2024 to see what they predict for the start of the final week of October.
Stock Market Outlook: SPX Closing Chart For Fri Oct 25 2024
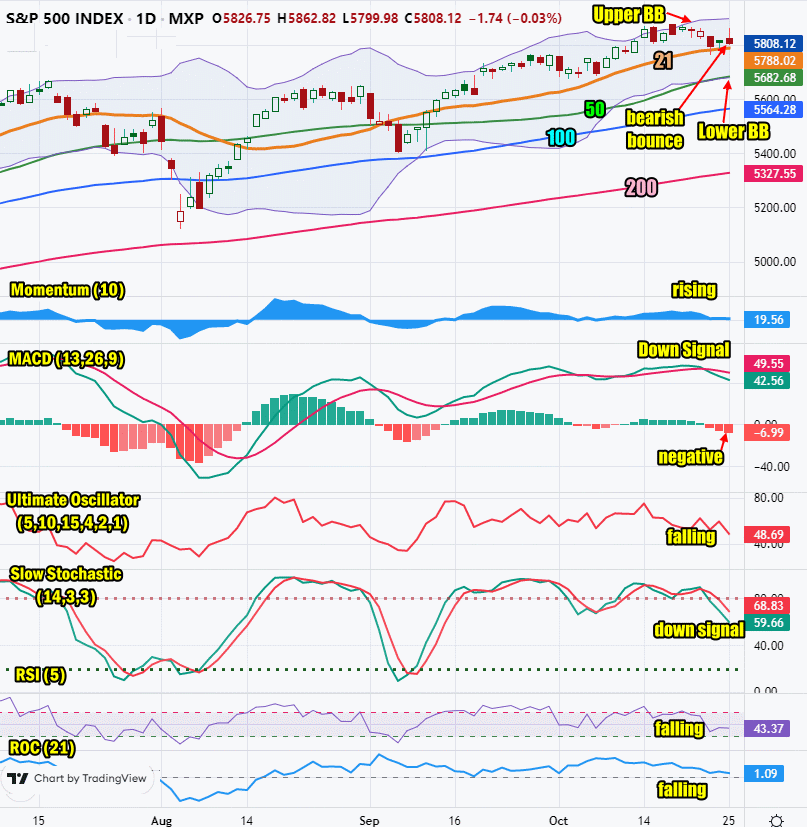
The index closed below the Upper Bollinger Band and just above the 21 day moving average. This is bearish.
The closing candlestick has a long shadow (head) which signals a bounce is likely for Monday especially at the open or early morning.
The 21 day moving average is higher at 5788. This is bullish but the rise in the 21 day is slowing.
The 50 day moving average is higher at 5682. This is bullish.
The 100 day moving average is rising and closed at 5564 which is bullish.
The 200 day moving average is in an uptrend and closed at 5327 which is bullish.
The Lower Bollinger Band is just below the 50 day moving average which is bearish. The Upper Bollinger Band is turned sideways which is still bullish.
The S&P chart is more bearish than bullish for Monday but is signaling a bounce and probable higher close is anticipated.

SPX Stock Market Outlook review of Fri Oct 25 2024
Stock Market Outlook: Technical Indicators Review
Momentum: Momentum is rising and positive.
|
MACD Histogram: MACD (Moving Averages Convergence / Divergence) issued a down signal on Wed Oct 23 2024. On Friday the down signal gained strength which is readily seen in the MACD histogram.
|
Ultimate Oscillator: The Ultimate Oscillator is falling and positive.
|
Slow Stochastic: The Slow Stochastic has a down signal in place.
|
Relative Strength Index: The RSI signal is falling.
|
Rate of Change: The rate of change signal is falling signaling a flat to lower close for Monday.
|
Stock Market Outlook: Support and Resistance Levels |
| 5890 is resistance |
| 5875 is resistance |
| 5850 is resistance |
| 5815 is resistance |
| 5800 is resistance |
| 5790 is resistance |
| 5775 is resistance |
| 5765 is support |
| 5750 is support |
| 5725 is support |
| 5700 is support |
| 5680 is support |
| 5650 is support |
| 5625 is support |
| 5600 is support |
| 5575 is support |
| 5550 is light support |
| 5525 is support |
| 5500 is support |
Stock Market Outlook for Mon Oct 28 2024
On Monday the index should see a bounce to start the day or certainly early in the morning. On the weekend oil prices eased which should also help. If treasury yields drop, even slightly, that too will help the index on Monday.
Monday before the open we get earnings from ON Semiconductor Stock (ON). If they miss by a wide margin it will impact semiconductor stocks and the market. Overall though, even with weakness in the technical indicators, investors are still quite bullish and that should help the index close higher, even if only slightly.
Potential Economic and Political Market Moving Events
Monday:
No economic reports
