The October non-farm payroll numbers were well beyond any estimates. August and September monthly numbers were also increased significantly pointing to the best jobs market since 1969 and the longest domestic economic expansion in history. That was more than enough to push stocks higher on Friday.
The NASDAQ and S&P made new all-time intraday and closing highs on Friday. The Dow is within 51 points of a new high.
The strength of the move higher on Friday was excellent on both volume and breadth of stocks participating. The close was at the high of the day with heavy buying seen in the last 5 minutes of the day. This has left the SPX and NASDAQ indexes overbought. Let’s take a look at Friday’s action on the SPX.
Stock Market Outlook Chart Comments At The Close on Fri Nov 1 2019
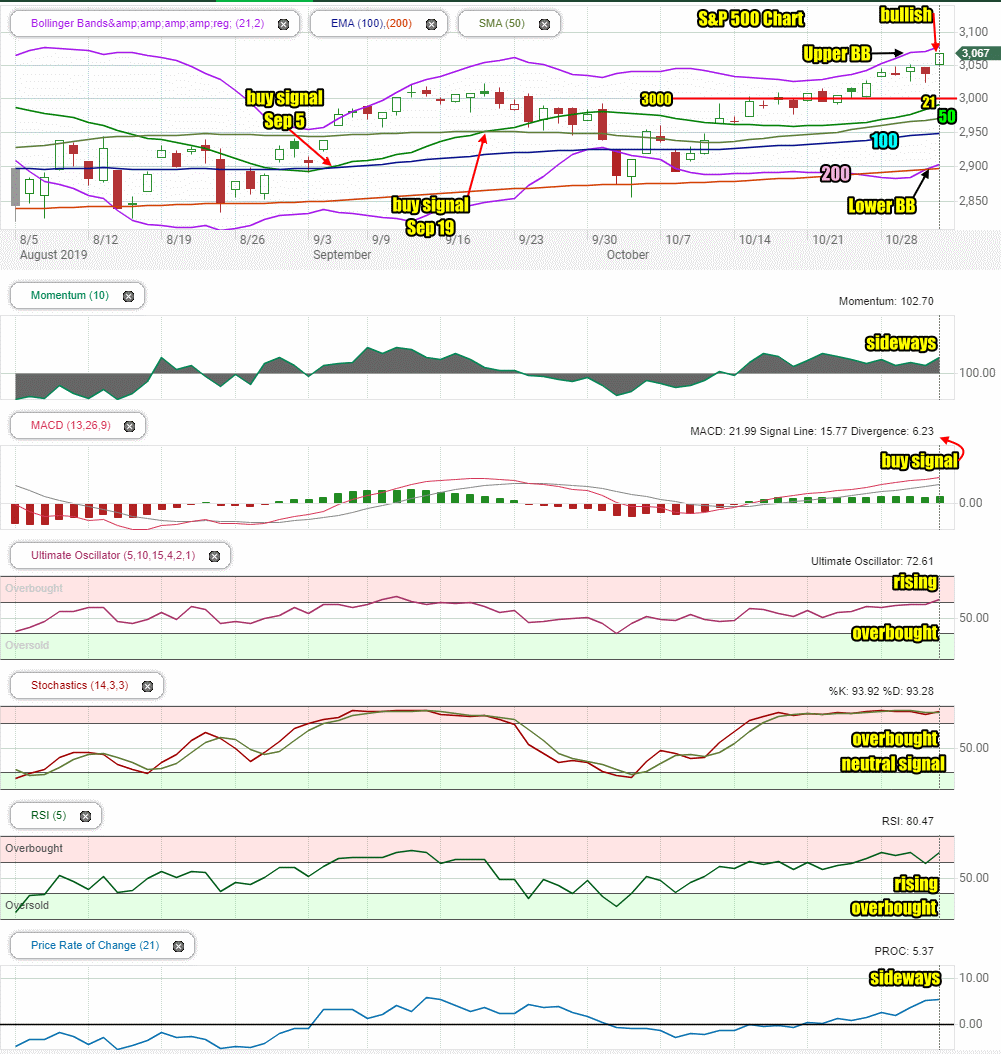
The SPX chart is bullish and closed above 3000 again on Friday and at new all-time highs. The Upper Bollinger Band is rising and the Lower Bollinger Band is also rising. This is bullish for the start of the first week of November.
The closing candlestick on Friday is bullish for Monday but also indicate an overbought market which often will shows signs of weakness, especially in the morning.
All the major moving averages are climbing including the 50 and 21 day moving averages. The 21 day moving average is now at the same height we saw late September. A break above will be bullish. A move sideways will be worrisome for a potential dip. At present all signs point to the 21 day rising further and breaking out.
The two buy signals from September are still in place.
The 200 day moving average is at the Lower Bollinger Band which might be short-term bearish and indicate a sideways action could develop. This needs to be watched for the start of the week.
Stock Market Outlook Review of Nov 1 2019
Stock Market Outlook: Technical Indicators Review:
Momentum: Momentum is positive and while it did rise on Friday it is still moving more sideways than up or down.
- Settings: For momentum I use a 10 period when studying market direction.
MACD Histogram: MACD (Moving Averages Convergence / Divergence) issued an up signal on Tue Oct 15 2019. The up signal was strong again on Friday, which points to more upside ahead for the index.
- Settings: For MACD Histogram, I am using the Fast Points set at 13, Slow Points at 26 and Smoothing at 9.
Ultimate Oscillator: The Ultimate Oscillator signal is positive and rising. It is also entering overbought readings.
- Settings: The Ultimate Oscillator settings are: Period 1 is 5, Period 2 is 10, Period 3 is 15, Factor 1 is 4, Factor 2 is 2 and Factor 3 is 1. These are not the default settings but are the settings I use with the S&P 500 chart set for 1 to 3 months.
Slow Stochastic: The Slow Stochastic is extremely overbought with a neutral signal to start the week. It is neither bullish or bearish.
- Settings: For the Slow Stochastic I use the K period of 14 and D period of 3. The Slow Stochastic tries to predict the market direction further out than just one day.
Relative Strength Index: The RSI signal is rising and overbought.
- Settings: The relative strength index is set for a period of 5 which gives it 5 days of market movement to monitor. It is often the first indicator to show an overbought or oversold signal.
Rate of Change: The rate of change signal is moving sideways with unchanged readings. Often this means no significant changes in prices should be expected.
- Settings: Rate Of Change is set for a 21 period. This indicator looks back 21 days and compares price action from the past to the present. With the Rate Of Change, prices are rising when signals are positive. Conversely, prices are falling when signals are negative. As an advance rises the Rate Of Change signal should also rise higher, otherwise the rally is suspect. A decline should see the Rate Of Change fall into negative signals. The more negative the signals the stronger the decline.
Support and Resistance Levels To Be Aware Of:
3000 is support
2960 is light support
2950 was light support
2900 is light support
2860 is light support
2840 is support
2800 is strong support
2795 is light support
2745 to 2750 is light support
2725 is light support
2700 is light support
2675 is light support
2650 is support
2625 is light support
2600 is support.
Stock Market Outlook for Tomorrow – Mon Nov 4 2019
Monday will start with the SPX index at an all-time high. It is also starting with overbought signals and many sideways or “unchanged” signals. This almost always means we will see a dip in the morning which should be tradable. The chance of the dip being deep is very small, as it will be snapped up by investors who are not yet in the rally.
In general the technical indicators are positive and either unchanged for Monday’s open or rising. There are no signals pointing to a deeper dip for Monday. That means I will be trading any and all dips on Monday. The outlook is for a flat to higher close by the end of the day on Monday as the bias is still higher, even with a morning dip.
Stock Market Outlook Archives

Morning Investing Strategy Notes for Thu Apr 3 2025

Stock Market Outlook for Thu Apr 3 2025 – Bearish Following Higher Than Expected Tariffs

Morning Investing Strategy Notes for Wed Apr 2 2025

Stock Market Outlook for Wed Apr 2 2025 – Tariffs Day – Still Bearish – Bounce Attempt Likely

Morning Investing Strategy Notes for Tue Apr 1 2025

Stock Market Outlook for Tue Apr 1 2025 – Nice Bounce But Still Bearish

Morning Investing Strategy Notes for Mon Mar 31 2025

Stock Market Outlook for Mon Mar 31 2025 – Bounce Attempt Likely But Still Bearish

Morning Investing Strategy Notes for Fri Mar 28 2025

Stock Market Outlook for Fri Mar 28 2025 – Weakness Into The Weekend

Morning Investing Strategy Notes for Thu Mar 27 2025

Stock Market Outlook for Thu Mar 27 2025 – Bounce Attempt

Morning Investing Strategy Notes for Wed Mar 26 2025

Stock Market Outlook for Wed Mar 26 2025 – A Little Weakness But Still Higher

Morning Investing Strategy Notes for Tue Mar 25 2025
Stock Market Outlook for Tue Mar 25 2025 – MACD Up Signal Confirmed

Morning Investing Strategy Notes for Mon Mar 24 2025
Stock Market Outlook for Mon Mar 24 2025 – Unconfirmed MACD Up Signal

Morning Investing Strategy Notes for Fri Mar 21 2025
