Prior Trading Day Summary:
On Friday investors continued the rally and pushed above 6000 before closing just below it at 6995 for a 22 point gain. For the week the SPX was up an impressive 266 points. Volume was still strong at 4.8 billion shares traded but half the volume was being traded to the downside as investors took profits.
The NASDAQ rose just 17 points ending the week at 19286 but for the week it added 1046 points. Volume was 7.5 billion shares, well above average. Up volume was 54% of all trades done.
It was a spectacular week for stocks. This week stocks will need to consolidate gains at some point and there will be some lower closes but the outlook remains bullish.
Let’s review the technical signals from Fri Nov 8 2024 to see what they predict for Mon Nov 11 2024.
Stock Market Outlook: SPX Closing Chart For Fri Nov 8 2024
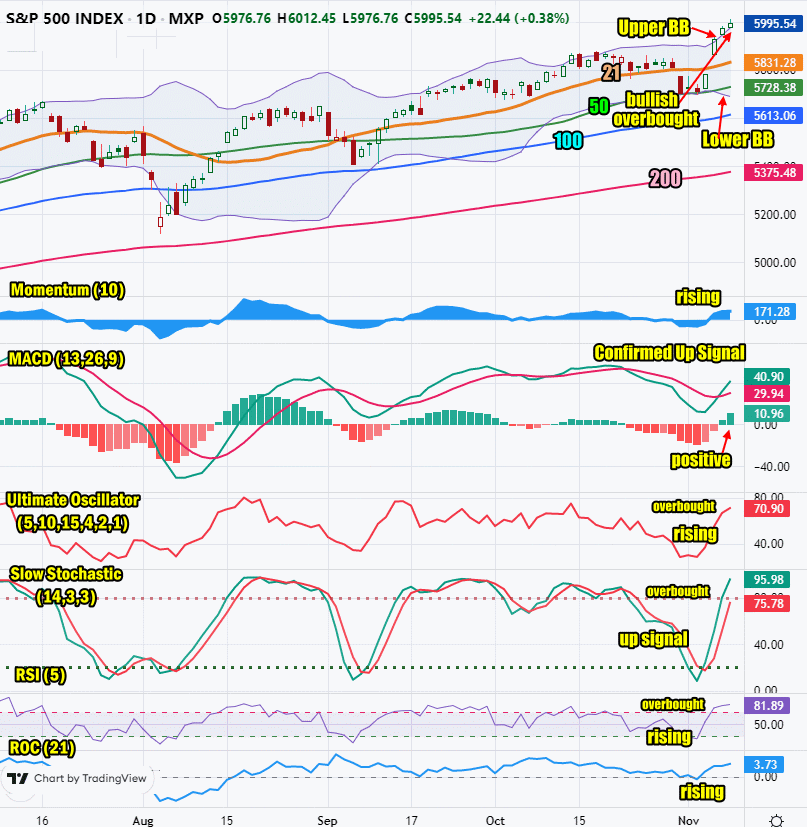
The index traded all day above the Upper Bollinger Band and all major moving averages. This is bullish.
The closing candlestick is bullish for Monday but signaling overbought. There is a huge gap from last week’s Tuesday’s close and Wednesday’s open. Often the market will fail in that gap at some point in a pullback but the chance of it happening early this week is none.
The 21 day moving average rose and is at 5831. This is bullish.
The 50 day moving average is higher at 5728. This is bullish.
The 100 day moving average is rising and closed at 5613 which is bullish.
The 200 day moving average is in an uptrend and closed at 5375 which is bullish.
The Lower Bollinger Band is below the 50 day moving average which is bullish. The Upper Bollinger Band is moving higher which is bullish as the Bollinger Bands widen which signals a higher move is still ahead for the index.
The S&P chart is bullish for Monday but is signaling very overbought.

SPX Stock Market Outlook review of Fri Nov 8 2024
Stock Market Outlook: Technical Indicators Review
Momentum: Momentum is rising and positive.
|
MACD Histogram: MACD (Moving Averages Convergence / Divergence) issued an up signal on Thu Nov 7 2024. The upsignal was confirmed on Friday.
|
Ultimate Oscillator: The Ultimate Oscillator is rising and overbought.
|
Slow Stochastic: The Slow Stochastic has an up signal in place and overbought.
|
Relative Strength Index: The RSI signal is rising and overbought.
|
Rate of Change: The rate of change signal is rising which indicates a higher day is likely for Monday.
|
Stock Market Outlook: Support and Resistance Levels |
| 6025 is resistance |
| 6015 is resistance |
| 6000 is resistance |
| 5990 is resistance |
| 5970 is resistance |
| 5950 is resistance |
| 5900 is rsistance |
| 5890 is resistance |
| 5875 is resistance |
| 5850 is resistance |
| 5815 is resistance |
| 5800 is support |
| 5790 is support |
| 5775 is support |
| 5765 is support |
| 5750 is support |
| 5725 is support |
| 5700 is support |
Stock Market Outlook for Mon Nov 11 2024
Historically the index has ended higher on Veteran’s Day over 65% of the time since my records from 1974. Part of the reason is the bond market is closed which often supports stocks rising.
With the majority of the S&P and NASDAQ overbought, there will be dips but for Monday there is room to the upside for stocks. The index is expected to close above the 6000 level on Monday.
Potential Economic and Political Market Moving Events
Monday:
Veterans Day. Bond market is closed.

