Friday saw stocks bounce as expected. The indexes were oversold and the drop to another new correction low on Thursday sparked more buying on Friday. While markets moved higher on Friday it was a technical oversold bounce but from the level it started, normally we can expect further upside before investors decide whether to trust the bounce or sell it back down.
The S&P closed up 93 points to end Friday at 4023.89 and back above 4000. It was the highest close for the week but the index still was down 99 points for the second week of May.
The NASDAQ rose 434 points to close at 11,805 and was down 339 points for the week.
Let’s review the closing technical indicators from Friday to see whether the bulls can keep the party going on Monday.
Stock Market Outlook Chart Comments At The Close on Fri May 13 2022
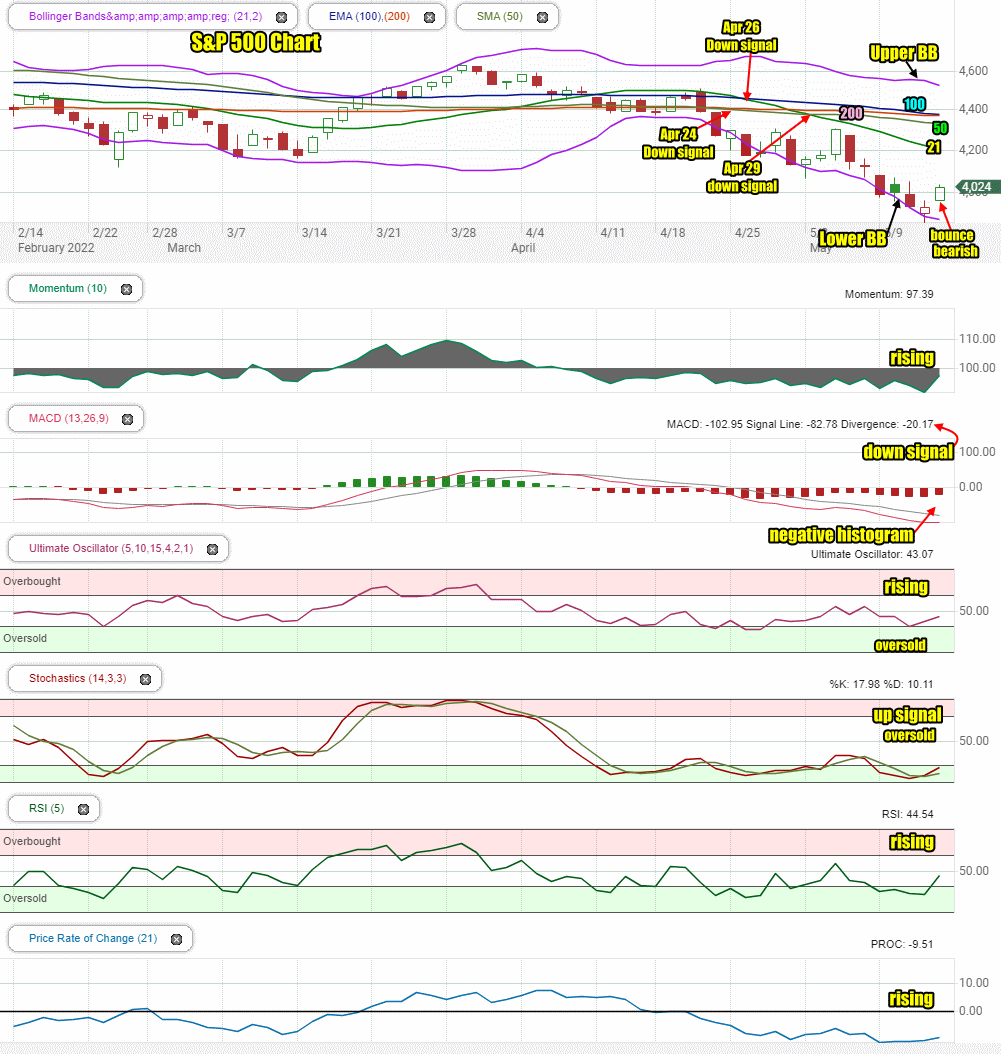
On Friday the day ended with a bearish candlestick again but signaling bounce underway.
Note that the Upper Bollinger Band has turned down which is bearish. The Lower Bollinger Band though is starting to turn sideways which can be a bullish signal. The Upper Bollinger Band is turning lower primarily due to Thursday’s drop to a new correction low. That could quickly change on Monday if the index moves higher.
All moving averages are still bearish and there are still three sell signals in the index. All the major moving averages are falling including the 200 day. The 21 day is still falling rapidly. However the 100 day which has now reached the 200 day moving average, did not fall below it on Friday. If the index moves higher on Monday, the 100 day may begin a recovery back higher.
The chart is 80% bearish for Monday. All the bounces over the past three weeks have failed but this bounce has more strength than the prior bounce attempts.
Stock Market Outlook review of Fri May 13 2022
Stock Market Outlook: Technical Indicators Review:
Momentum: Momentum is rising but still negative. The rise though is sharp and could signal a further rise on Monday should be anticipated.
- Settings: For momentum I use a 10 period when studying market direction.
MACD Histogram: MACD (Moving Averages Convergence / Divergence) issued a down signal Friday April 8. On Friday the down signal lost strength and sis the MACD histogram.
- Settings: For MACD Histogram, I am using the Fast Points set at 13, Slow Points at 26 and Smoothing at 9.
Ultimate Oscillator: The Ultimate Oscillator is rising, negative but moving sharply higher.
- Settings: The Ultimate Oscillator settings are: Period 1 is 5, Period 2 is 10, Period 3 is 15, Factor 1 is 4, Factor 2 is 2 and Factor 3 is 1. These are not the default settings but are the settings I use with the S&P 500 chart set for 1 to 3 months.
Slow Stochastic: The Slow Stochastic has an up signal in place and is still showing some extreme oversold signals. This means a further upside should be expected.
Settings: For the Slow Stochastic I use the K period of 14 and D period of 3. The Slow Stochastic tries to predict the market direction further out than just one day.
Relative Strength Index: The RSI signal is sharply higher and no longer oversold.
- Settings: The relative strength index is set for a period of 5 which gives it 5 days of market movement to monitor. It is often the first indicator to show an overbought or oversold signal.
Rate of Change: The rate of change signal is rising, signaling price changes should be expected on Monday.
- Settings: Rate Of Change is set for a 21 period. This indicator looks back 21 days and compares price action from the past to the present. With the Rate Of Change, prices are rising when signals are positive. Conversely, prices are falling when signals are negative. As an advance rises the Rate Of Change signal should also rise higher, otherwise the rally is suspect. A decline should see the Rate Of Change fall into negative signals. The more negative the signals the stronger the decline.
Support and Resistance Levels To Be Aware Of:
4400 is resistance
4370 is light support
4350 is light resistance
4300 is light resistance
4290 is light resistance
4270 is light resistance
4250 is resistance
4225 is light resistance
4200 is light resistance
4150 is light resistance
4100 is light support
4050 is light support
4025 is light support
4000 is good support
3975 is light support and is a decline of 17.5%
3900 is light support and is a decline of 19%
3850 is good support and is a decline of 20%
3600 is good support at is a decline of 25%
Stock Market Outlook for Tomorrow – Mon May 16 2022
For Monday the technical indicators are showing improvement and there are enough signals pointing to a higher day, that investors should expect Monday to end higher.
The morning could open higher, then see some selling pressure and early morning dips, before another move higher either over the lunch hour or into the start of the afternoon. Don’t be surprised if the final hour or half hour sees more selling but that would have to break down to 4000 to stop this bounce form occurring. That at present is unlikely to happen. If you look at the support and resistance levels above, you can see that 4000 on the SPX has held up well over the past week. A move to 4100 should be easy for the SPX. After that, there is more resistance that will have to be broken through. For Monday however, the path higher will be easier for investors.
I am still holding SPY ETF calls from Friday’s open.
On Friday the Consumer Sentiment Index (UofMich) was lower than expected at 59.1 and continues the downtrend from earlier this year. Despite this though, at 59.1 it is still showing optimism among consumers and not much contraction in spending that analysts are continually warning is underway. The 5 year inflation expectation was unchanged at 3% which is encouraging, but this is a speculative number and not much more.
Potential Market Moving Events
These are the potential market moving events for the third week of May. Tuesday has the most important reports this week as far as market moving events are concerned.
Monday:
8:30 Empire State Manufacturing Index – was 24.6 for prior month
Tuesday:
8:30 Retail sales including with and without auto – was 0.8%. A higher percentage would bump stocks, especially retail stocks.
9:15 Industrial Production Index – was 0.9%
9:15 Capacity Utilization – was 78.3%. A higher number will be positive for stocks.
10:00 NAHB home builders index. – Was 77 – a higher number will be positive for stocks.
Wednesday:
8:30 Housing Starts – 1.79 million prior
8:30 Building Permits – 1.87 million prior
8:30 Philadelphia Fed Manufacturing Index – was 17.6 – a higher number could be construed as inflationary
Thursday:
8:30 Weekly Initial Unemployment Insurance Claims
10:00 Existing Home Sales – 5.77 million prior. A higher number will show the economy is expanding.
Friday:
No market moving reports
Stock Market Outlook Archives

Morning Investing Strategy Notes for Mon Apr 7 2025
Stock Market Outlook for Mon Apr 7 2025 – Bounce Possible At Any Time But Still Bearish and Lower For Now

Morning Investing Strategy Notes for Fri Apr 4 2025

Stock Market Outlook for Fri Apr 4 2025 – All About The March Jobs Numbers

Morning Investing Strategy Notes for Thu Apr 3 2025

Stock Market Outlook for Thu Apr 3 2025 – Bearish Following Higher Than Expected Tariffs

Morning Investing Strategy Notes for Wed Apr 2 2025

Stock Market Outlook for Wed Apr 2 2025 – Tariffs Day – Still Bearish – Bounce Attempt Likely

Morning Investing Strategy Notes for Tue Apr 1 2025

Stock Market Outlook for Tue Apr 1 2025 – Nice Bounce But Still Bearish

Morning Investing Strategy Notes for Mon Mar 31 2025

Stock Market Outlook for Mon Mar 31 2025 – Bounce Attempt Likely But Still Bearish

Morning Investing Strategy Notes for Fri Mar 28 2025

Stock Market Outlook for Fri Mar 28 2025 – Weakness Into The Weekend

Morning Investing Strategy Notes for Thu Mar 27 2025

Stock Market Outlook for Thu Mar 27 2025 – Bounce Attempt

Morning Investing Strategy Notes for Wed Mar 26 2025

Stock Market Outlook for Wed Mar 26 2025 – A Little Weakness But Still Higher

Morning Investing Strategy Notes for Tue Mar 25 2025
