 Prior Trading Day Summary:
On Fri Mar 28 2025 stocks plunged lower without any large rally attempt. This lead to more selling which saw the index close near the day’s low.
The SPX lost 112 points and ended the week down 86 points, closing at 5580. 77% of all stocks were falling on the SPX on Friday.
The NASDAQ had its worst day since Mar 10, falling 481 points with 78% of all stocks falling. The index closed at 17,323, down 461 points for the final week of March.
March was terrible for most stocks with the NASDAQ losing 1524 points in the month, down 8% in March. The SPX lost 373 points in March for a drop of 6.2%.
Let’s review the SPX technical indicators at the close on Fri Mar 28 2025 to see if stocks might try a bounce on Monday, although that appears rather unlikely.
Stock Market Outlook: SPX Closing Chart For Fri Mar 28 2025
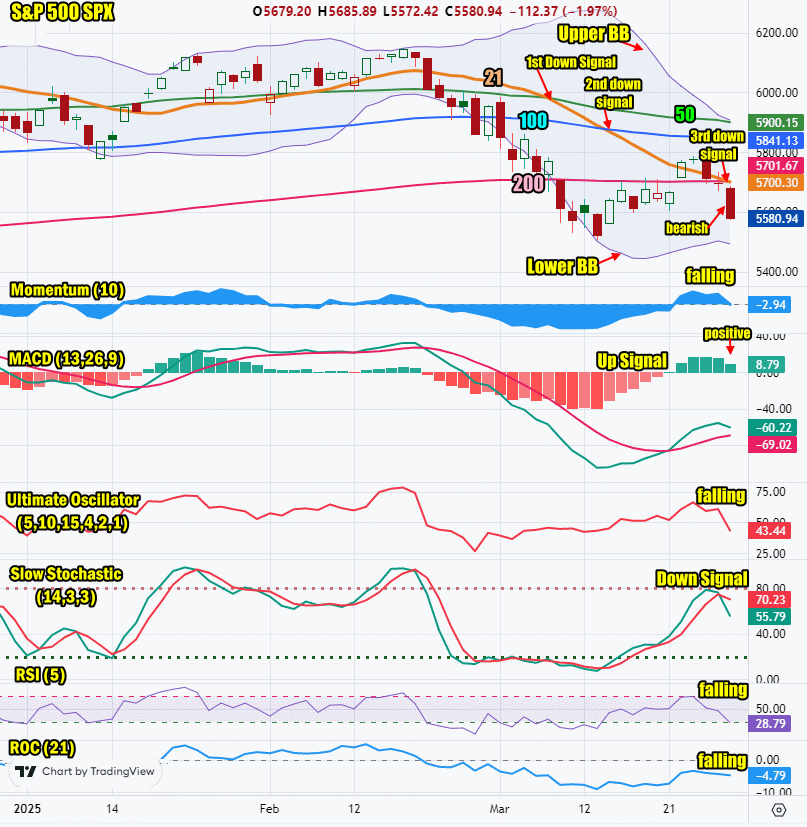
The index closed back below the 200 day moving average but above the low from March 13. This is bearish.
The closing candlestick suggests further downside is likely on Monday although a bounce should be expected at some point either Monday or Tuesday. This is bearish.
The 21 day moving average is falling and closed at 5700 which is bearish. The 21 day moving average fell below the 50 day on Friday Mar 7/ It fell below the 100 day on Thursday Mar 13 for a second down signal and on Friday it fell below the 200 day for a third down signal.
The 50 day moving average is falling and closed at 5900 which is bearish.
The 100 day moving average is falling and closed at 5841 which is bearish.
The 200 day moving average is falling and closed at 5700 which is bearish.
The Lower Bollinger Band is turning lower which is bearish and signals more downside is ahead. The Upper Bollinger Band is tfalling below the 50 day moving average which is bearish. A chance of a Bollinger Bands Squeeze is unlikely , at least for the first few days of April.
For Monday the SPX chart is still strongly bearish although it is signaling a small chance of a bounce.

SPX Stock Market Outlook review of Fri Mar 28 2025
Stock Market Outlook: Technical Indicators Review
Momentum: Momentum is falling and negative.
|
MACD Histogram: MACD (Moving Averages Convergence / Divergence) issued an up signal on Friday Mar 21 2025. The up signal was losing strength on Fri Mar 28.
|
Ultimate Oscillator: The Ultimate Oscillator is falling and negative.
|
Slow Stochastic: The Slow Stochastic has a down signal in place.
|
Relative Strength Index: The RSI signal is falling.
|
| Rate of Change: The rate of change signal is falling signaling a lower close is expected. Settings: Rate Of Change is set for a 21 period. This indicator looks back 21 days and compares price action from the past to the present. With the Rate Of Change, prices are rising when signals are positive. Conversely, prices are falling when signals are negative. As an advance rises, the Rate Of Change signal should also rise higher, otherwise the rally is suspect. A decline should see the Rate Of Change fall into negative signals. The more negative the signals the stronger the decline. |
Stock Market Outlook: Support and Resistance Levels |
| 6000 is resistance |
| 5970 is resistance |
| 5950 is resistance |
| 5900 is resistance |
| 5890 is resistance |
| 5875 is resistance |
| 5850 is resistance |
| 5800 is resistance |
| 5775 is resistance |
| 5750 is resistance |
| 5730 is resistance |
| 5700 is support |
| 5650 is support |
| 5630 is support |
| 5600 is support |
| 5585 is support |
| 5550 is support |
| 5500 is support |
| 5450 is support |
Stock Market Outlook for Mon Mar 31 2025
The technical indicators are continuing to gain strength to the bearish side. Only the MACD indicator is still positive but it lost a lost of strength on Friday. The 21 day is now below the 200 day for a third down signal. Tuesday is what the President has labeled Liberation Day. If investors are lucky, perhaps a bounce later in the week could assist stocks but for now, the outlook remains bearish and lower.
Luckily on Monday there is only one economic report and usually the Chicago business barometer does not move markets. The bulls may be a bit lucky on Monday but the day will end lower.
Potential Economic and Political Market Moving Events
Monday:
9:45 Chicago business barometer is expected to decline to 43.6 from 45.5

 Prior Trading Day Summary: