 Prior Trading Day Summary:
On Friday March 21 2025 the SPX had a wide range, falling to 5603 but closing slightly positive at 5667. Volume was 9.6 billion thanks to triple witching. Despite the higher close 62% of all volume was moving lower and 62% of stocks were falling.
The NASDAQ closed up 92 points to 17,784 but intraday the index was down at 17,474. Volume was 9.1 billion, again thanks to triple witching. 51% of all volume was falling as were 56% of all stocks.
However the higher close finally gave us a new up signal. While still unconfirmed, the MACD technical indicator has been very accurate over the past three years. On Friday it indicated the sell-off was over for now. Monday should see the up signal confirmed.
Let’s review the SPX technical indicators at the close on Fri Mar 21 2025 to see what to expect for the start of the final week of March.
Stock Market Outlook: SPX Closing Chart For Fri Mar 21 2025
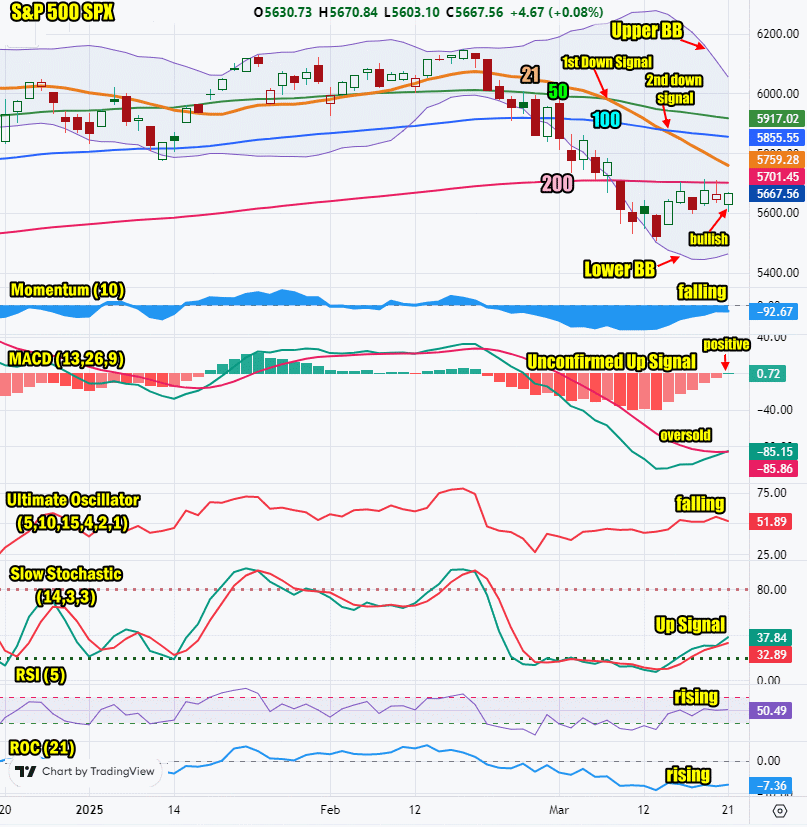
The index closed almost unchanged but below the 200 day. This is still bearish but a good sign for stocks.
The closing candlestick has a long shadow which suggests a dip is likely, probably in the morning.
The 21 day moving average is falling and closed at 5759 which is bearish. The 21 day moving average fell below the 50 day on Friday Mar 7 and on Thursday Mar 13 it fell below the 100 day for a second down signal.
The 50 day moving average is falling and closed at 5917 which is bearish.
The 100 day moving average is falling and closed at 5855 which is bearish.
The 200 day moving average is falling and closed at 5701 which is bearish.
The Lower Bollinger Band is turning higher which is bullish. The Upper Bollinger Band is turning sharply lower which may signal a chance the selling is ending. We may see a Bollinger Bands Squeeze this week and a move higher.
For Monday the SPX chart is still strongly bearish with a signal lower intraday. However there are positive signs developing.

SPX Stock Market Outlook review of Fri Mar 21 2025
Stock Market Outlook: Technical Indicators Review
Momentum: Momentum is falling and negative.
|
MACD Histogram: MACD (Moving Averages Convergence / Divergence) issued a down signal on Mon Feb 21 2025. On Fri Mar 21 2025, a new but unconfirmed up signal was generated.
|
Ultimate Oscillator: The Ultimate Oscillator is falling but positive.
|
Slow Stochastic: The Slow Stochastic has an up signal in place.
|
Relative Strength Index: The RSI signal is rising.
|
| Rate of Change: The rate of change signal is rising signaling a higher close is expected. Settings: Rate Of Change is set for a 21 period. This indicator looks back 21 days and compares price action from the past to the present. With the Rate Of Change, prices are rising when signals are positive. Conversely, prices are falling when signals are negative. As an advance rises, the Rate Of Change signal should also rise higher, otherwise the rally is suspect. A decline should see the Rate Of Change fall into negative signals. The more negative the signals the stronger the decline. |
Stock Market Outlook: Support and Resistance Levels |
| 6000 is resistance |
| 5970 is resistance |
| 5950 is resistance |
| 5900 is resistance |
| 5890 is resistance |
| 5875 is resistance |
| 5850 is resistance |
| 5800 is resistance |
| 5775 is resistance |
| 5750 is resistance |
| 5730 is resistance |
| 5700 is support |
| 5650 is support |
| 5630 is support |
| 5600 is support |
| 5585 is support |
| 5550 is support |
| 5500 is support |
| 5450 is support |
Stock Market Outlook for Mon Mar 24 2025
For Monday the MACD technical indicator has a new but unconfirmed up signal in place. I expect it will be confirmed today by the close. The closing candlestick on Friday shows a chance for a dip mid-morning but a higher close is still expected on the day.
Overall the index is turned sideways and just needs to move above the 200 day to draw in fresh capital. Until that happens, stocks will continue to face selling.
Monday then should see the index end the day higher.
Potential Economic and Political Market Moving Events
Monday:
9:45 S&P flash services PMI is expected to rise slightly to 51.5 from 51.0 prior
9:45 S&P flash manufacturing PMI is expected to dip to 51.5 from 52.7 prior

 Prior Trading Day Summary: