
Thursday Dec 31 2020, saw the SPX stage a rally to end the year. The S&P rose to a new all time high of 3760 intraday before closing at 3756. The NASDAQ rose 18 points to close at 12,888 just 85 points from its all-time high. It was an excellent close to end perhaps one of the strangest investing years in decades as the index fell into a bear market late February and through almost all of March. It then climbed out of the bear by early summer, marking the shortest bear market, technically, on record. Let’s look at the close on Dec 31 and see what it can tell us we might expect for the first trading day of 2021.
Stock Market Outlook Chart Comments At The Close on Thu Dec 31 2020
On Thursday the index closed just above the Upper Bollinger Band. Once again in the chart below, you can see that the Bollinger Bands are starting to spread apart. While this might be an early signal of the end of the latest Bollinger Bands Squeeze, it is questionable at present whether this is just part of the historic and highly anticipated Santa Claus Rally. We should know more shortly as the market enters the final stage of what is usually the end of the Santa Claus Rally by tomorrow.
The major moving averages are still rising which continues to suggest that new highs lie ahead for the S&P. The up signal from Oct 21 is still very much in play for the start of the new year.
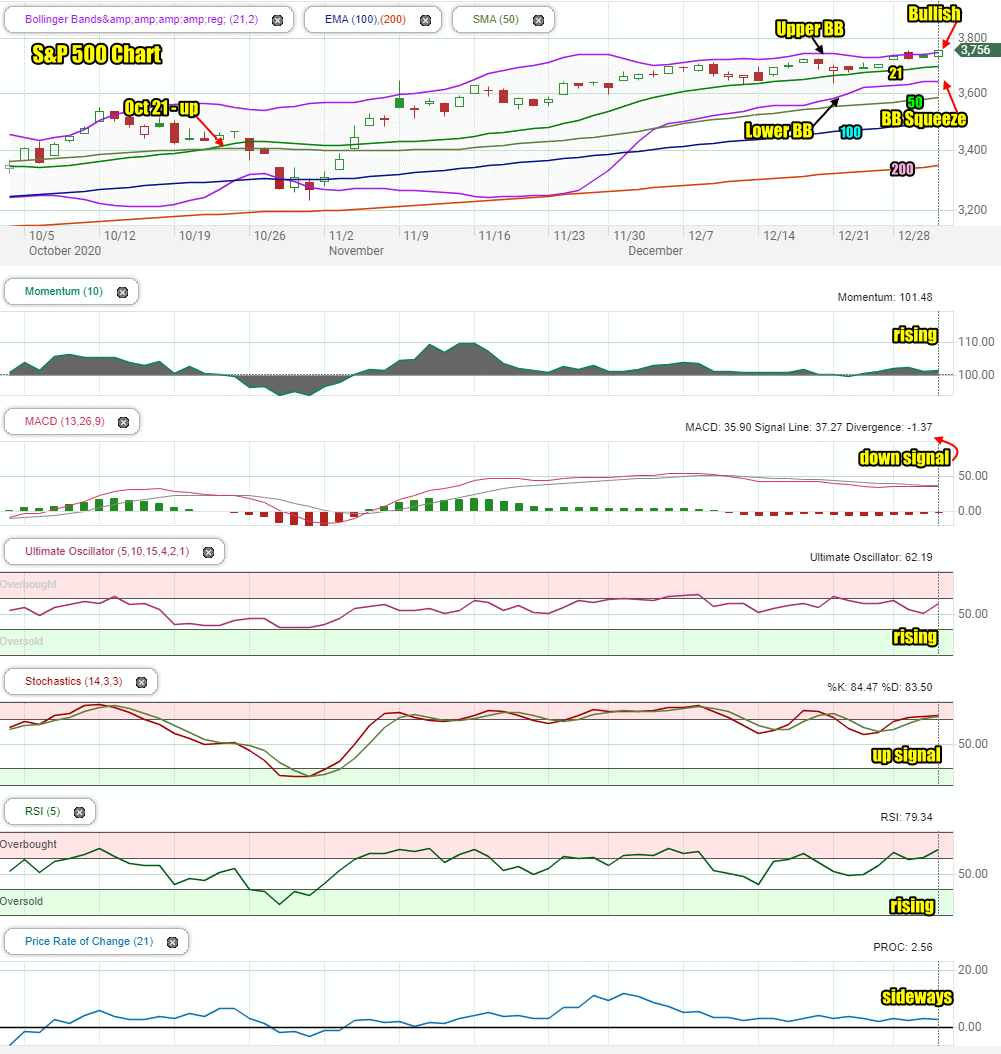
Stock Market Outlook review of Thu Dec 31 2020
Stock Market Outlook: Technical Indicators Review:
Momentum: Momentum is rising and positive.
- Settings: For momentum I use a 10 period when studying market direction.
MACD Histogram: MACD (Moving Averages Convergence / Divergence) issued a a down signal on Dec 10. The down signal was very weak on Thursday and we could get an unconfirmed up signal as early as Monday.
- Settings: For MACD Histogram, I am using the Fast Points set at 13, Slow Points at 26 and Smoothing at 9.
Ultimate Oscillator: The Ultimate Oscillator is rising.
- Settings: The Ultimate Oscillator settings are: Period 1 is 5, Period 2 is 10, Period 3 is 15, Factor 1 is 4, Factor 2 is 2 and Factor 3 is 1. These are not the default settings but are the settings I use with the S&P 500 chart set for 1 to 3 months.
Slow Stochastic: The Slow Stochastic has an up signal in place but the signal is almost neutral.
Settings: For the Slow Stochastic I use the K period of 14 and D period of 3. The Slow Stochastic tries to predict the market direction further out than just one day.
Relative Strength Index: The RSI signal is rising and starting to enter overbought readings.
- Settings: The relative strength index is set for a period of 5 which gives it 5 days of market movement to monitor. It is often the first indicator to show an overbought or oversold signal.
Rate of Change: The rate of change signal is trending sideways.
- Settings: Rate Of Change is set for a 21 period. This indicator looks back 21 days and compares price action from the past to the present. With the Rate Of Change, prices are rising when signals are positive. Conversely, prices are falling when signals are negative. As an advance rises the Rate Of Change signal should also rise higher, otherwise the rally is suspect. A decline should see the Rate Of Change fall into negative signals. The more negative the signals the stronger the decline.
Support and Resistance Levels To Be Aware Of:
3750 is resistance
3700 is light support
3600 is strong support
3550 is support
3500 is strong support
3450 is support
3400 is support
3375 is support
3300 is strong support
3275 is support
3200 is support
3150 is support
3050 is support
3000 is strong support
Stock Market Outlook for Tomorrow – Mon Jan 4 2021
Historically the first two trading days of the New Year are the final days of the Santa Claus Rally. Historically any year that stocks failed to rally since 1950, during the final week of the old year and first two days of the New Year has seen a better time later in the New Year to buy stocks.
The first full trading week of January is also a good predictor of what to expect for the rest of the year. If the first week of January is higher, 80% of the time the year has ended higher. We saw this happen in 2020 with the index ending the year at a historic high Dec 31.
As well, if January has been lower from the opening of the first day of trading to the final day of trading, markets can expect some turbulence during the year. This has happened every year since 1950. This can include a bear market, a continuation of an existing bear market or a correction during the year of at least 10%.
On Jan 2 2020 the SPX opened at 3244. On Jan 31 2020 the SPX ended at 3225, marking a lower close. We all know what followed. The S&P plunged late February through most of March to below 2200 before rebounding.
For Monday Jan 4, the index is set to end the day higher. Over the past 22 years, the index has been higher 72% of the time on the first trading day of a new year.
The technical indicators are a bit mixed which also indicates investors should not be surprised by dips intraday, but the close will be higher to start 2021.
Stock Market Outlook Archives
Morning Investing Strategy Notes for Thu Apr 10 2025
Stock Market Outlook for Thu Apr 10 2025 – Choppy Day With Dips Likely But Higher Close

Morning Investing Strategy Notes for Wed Apr 9 2025

Stock Market Outlook for Wed Apr 9 2025 – Bearish Bounce – Panic and Lower

Morning Investing Strategy Notes for Tue Apr 8 2025
Stock Market Outlook for Tue Apr 8 2025 – Bounce Likely But Highly Suspect

Morning Investing Strategy Notes for Mon Apr 7 2025
Stock Market Outlook for Mon Apr 7 2025 – Bounce Possible At Any Time But Still Bearish and Lower For Now

Morning Investing Strategy Notes for Fri Apr 4 2025

Stock Market Outlook for Fri Apr 4 2025 – All About The March Jobs Numbers

Morning Investing Strategy Notes for Thu Apr 3 2025

Stock Market Outlook for Thu Apr 3 2025 – Bearish Following Higher Than Expected Tariffs

Morning Investing Strategy Notes for Wed Apr 2 2025
Stock Market Outlook for Wed Apr 2 2025 – Tariffs Day – Still Bearish – Bounce Attempt Likely

Morning Investing Strategy Notes for Tue Apr 1 2025
Stock Market Outlook for Tue Apr 1 2025 – Nice Bounce But Still Bearish

Morning Investing Strategy Notes for Mon Mar 31 2025

Stock Market Outlook for Mon Mar 31 2025 – Bounce Attempt Likely But Still Bearish

Morning Investing Strategy Notes for Fri Mar 28 2025
