 Prior Trading Day Summary:
Fri April 11 2025 was a choppy day but with a higher close as investors continued to try to push stocks higher toward the 200 day moving average.
Volumes fell on Friday as many investors who want into stocks, used Thursday’s volatility and weakness to enter trades.
The SPX traded 5.7 billion shares with 81% of that volume rising. 70% of stocks rose on Friday capping off a wild week for stocks with a final gain of 289 points. The SPX closed at 5363.
The NASDAQ traded 9.7 billion shares, a drop of 2.6 billion shares from Thursday. New lows on Thursday had reach 1401, but on Friday new lows were just 204. 64% of volume was moving higher along with 66% of stocks on the index. For the week, the NASDAQ rose 1136 points. The prior week the NASDAQ lost 1735 points. The second week, although volatile, saw the index recover 65% of what had been lost.
With stocks entering the next quarterly earnings seasons, let’s review the technical indicators at the close on Fri Apr 11 2025 to see what they predict for stocks for the start of the third week of April.
Stock Market Outlook: SPX Closing Chart For Fri Apr 11 2025
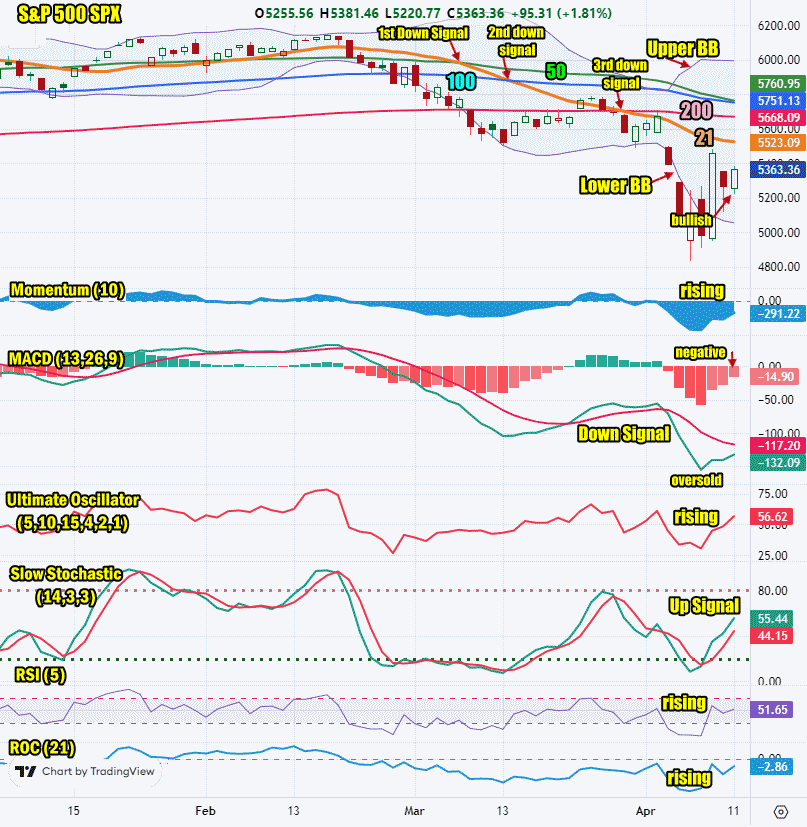
The index closed below the 200 day moving average and below Wednesday’s high which is bearish.
The closing candlestick is bullish but points and points to a chance for a dip but a higher close is predicted.
The 21 day moving average is falling and closed at 5523. The 21 day moving average fell below the 50 day on Friday Mar 7/ It fell below the 100 day on Thursday Mar 13 for a second down signal and on Friday Mar 28 it fell below the 200 day for a third down signal.
The 50 day moving average is falling and closed at 5760 which is bearish. The 50 days in on the verge of falling below the 100 day. This would be another down signal.
The 100 day moving average is falling and closed at 5751 which is bearish.
The 200 day moving average is falling and closed at 5668 which is bearish.
All the moving averages are continuing their decline and the 50 day could fall below the 100 day early this week which would be a bearish signal.
The Lower Bollinger Band is once again falling. The Upper Bollinger Band is trending sideways which is signaling a change is coming to the direction. This is neutral due to Friday’s higher close.
For Monday the SPX chart is still very bearish but the candlestick is signaling while a dip is possible, a higher close should be expected.

SPX Stock Market Outlook review of Fri Apr 11 2025
Stock Market Outlook: Technical Indicators Review
Momentum: Momentum is rising and negative. It is still somewhat oversold. The reading is strongly negative at -291.
|
MACD Histogram: MACD (Moving Averages Convergence / Divergence) issued a down signal on Thu Apr 3 2025. On Fri Apr 11 2025 the down signal lost more strength.
|
Ultimate Oscillator: The Ultimate Oscillator is rising and positive. It is not oversold.
|
Slow Stochastic: The Slow Stochastic has an up signal in place. It is signaling we should expect a higher day for today.
|
Relative Strength Index: The RSI signal is rising and not oversold.
|
| Rate of Change: The rate of change signal is rising and signaling a higher close for Monday. Settings: Rate Of Change is set for a 21 period. This indicator looks back 21 days and compares price action from the past to the present. With the Rate Of Change, prices are rising when signals are positive. Conversely, prices are falling when signals are negative. As an advance rises, the Rate Of Change signal should also rise higher, otherwise the rally is suspect. A decline should see the Rate Of Change fall into negative signals. The more negative the signals the stronger the decline. |
Stock Market Outlook: Support and Resistance Levels |
| 5800 is resistance |
| 5775 is resistance |
| 5750 is resistance |
| 5730 is resistance |
| 5700 is resistance |
| 5650 is resistance |
| 5630 is resistance |
| 5600 is resistance |
| 5550 is resistance |
| 5500 is resistance |
| 5450 is support |
| 5400 is support |
| 5230 is support |
| 5000 is support |
| 4770 is support |
| 4680 is support |
| 4500 is support |
| 4365 is support |
| 4150 is support |
| 4000 is support |
Stock Market Outlook for Mon Apr 14 2025
For Monday the technical indicators are advising that the morning should open higher or with a bit of a bounce but then turn choppy. Sideways action is expected along with a potential dip. The close though still looks higher. With no reports due out on Monday, stocks could try to stage a higher day if Goldman Sachs Stock (GS) beats estimates and beats their earnings for the same period last year.
Potential Economic and Political Market Moving Events
Monday:
No reports

 Prior Trading Day Summary: