 Thursday saw investors take profits, especially after President-elect Trump’s Wednesday news conference which did not lay out any economic details of his planned lower corporate tax rates. Investors decided that now was the time to leave some of their positions and lock in profits from the Trump rally.
Tomorrow though could see a change as a number of banks will report their earnings before the markets open.
Strong earnings or even earnings that meet estimates could be all it takes for the markets to push back to their all-time highs.
Indexes End Of Day Closings
S&P Index Close
The S&P index ended the day down 4.88 to close at 2270.44.
Dow Jones Index
The Dow Jones closed down 63.28 at 19,891.00
NASDAQ Index Close
The NASDAQ closed down 16.16 ending the day at 5547.49.
Stock Market Outlook

Stock Market Outlook review of Jan 12 2017
Chart Comments At The Close:
The Bollinger Bands Squeeze I discussed over the last few nights is still continuing. It is still too early to tell which way the squeeze will move. Today the SPX broke through the 21 day moving average and fell to 2254.25 before recovering back to 2270. This was a bit of a serious drop but buyers returned quickly to snap up some stocks that had fallen, which in turn moved the index back to the important 2270 level.
This now needs to be watched. Another move this low will break to 2250 and a break of 2250 will be bearish with stocks slipping probably to 2225.
Support Levels To Be Aware Of:
The market has been trying to build support at the 2250 level. Today’s break to 2254 is either going to assist building support at the 2250 level or set the market up to break through it shortly. There is light support at 2195 but better support is at 2180 and then 2150.
Stock Market Outlook: Technical Indicators:

Stock Market Outlook technical review for Jan 12 2017
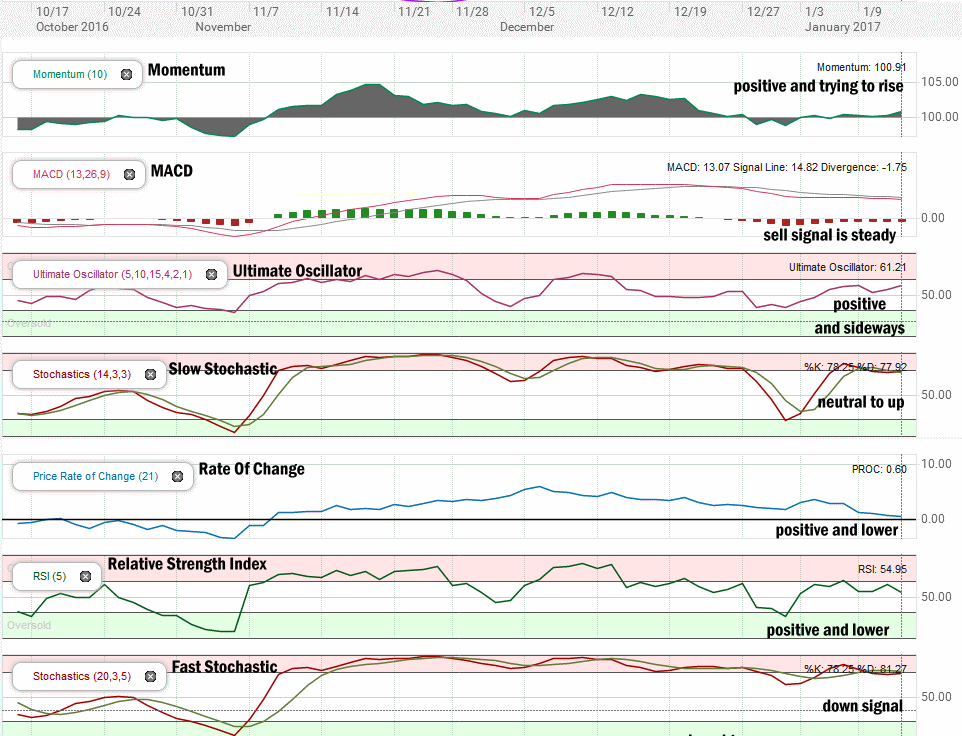
Momentum: For momentum I use a 10 period when studying market direction. Momentum is still positive and today it was trying to move higher toward the end of the day.
MACD Histogram: For MACD Histogram, I am using the Fast Points set at 13, Slow Points at 26 and Smoothing at 9. MACD (Moving Averages Convergence / Divergence) issued a sell signal Dec 23 2016. The sell signal has been steady the past several days but it is not gaining strength which could be significant for the bulls.
Ultimate Oscillator: The Ultimate Oscillator settings are: Period 1 is 5, Period 2 is 10, Period 3 is 15, Factor 1 is 4, Factor 2 is 2 and Factor 3 is 1. These are not the default settings but are the settings I use with the S&P 500 chart set for 1 to 3 months. The Ultimate Oscillator is positive and moving sideways.
Slow Stochastic: For the Slow Stochastic I use the K period of 14 and D period of 3. The Slow Stochastic tries to predict the market direction further out than just one day. The Slow Stochastic has changed its signal from down to neutral to up.
Rate of Change: Rate Of Change is set for a 21 period. This indicator looks back 21 days and compares price action from the past to the present. The rate of change signal is positive but moving lower which indicates prices will be falling shortly.
Relative Strength Index: The relative strength index is set for a period of 5 which gives it 5 days of market movement to monitor. It often is the first indicator to show an overbought or oversold signal. It is positive and and moving lower but as you can see in the chart it is moving more sideways than up or down. This indicates strength in the underlying trend, which is still up.
Fast Stochastic: For the Fast Stochastic I use the K period of 20 and D period of 5. These are not default settings, but settings I use for the 1 to 3 month S&P 500 chart when I have it set for daily views. The Fast Stochastic is signaling down and is also overbought.
Stock Market Outlook for Tomorrow – Friday Jan 13 2017
For Friday Jan 13 2017 , a lot depends on the banks. In fact, most probably will depend on the bank earnings. If they meet or exceed expectations the S&P should move higher.
Technically one of the sell signals changed to a weak up signal today. This leaves only 2 indicators as negative with sell signals and neither of them have strong sell signals in place. The remaining signals are positive and while some are weak, overall they are still quite bullish. Momentum is definitely interesting as it changed to up from sideways today and failed to turn negative since the start of the year despite weakness at times from the S&P. This is indeed a bullish sign.
For Friday then, a lot of the market direction outlook depends on the bank earnings, but in general the outlook is not actually changed. It is still sideways with a bias to the upside. If however bank earnings fail to meet estimates, the S&P will drop back and probably break through the 2250 level and hit 2225. This won’t break the rally but could shake up investors.
Stay FullyInformed With Email Updates
Market Direction Internal Links
Profiting From Understanding Market Direction (Articles Index)
Understanding Short-Term Signals
Market Direction Portfolio Trades (Members)
Market Direction External Links
IWM ETF Russell 2000 Fund Info
Market Direction SPY ETF 500 Fund Info
