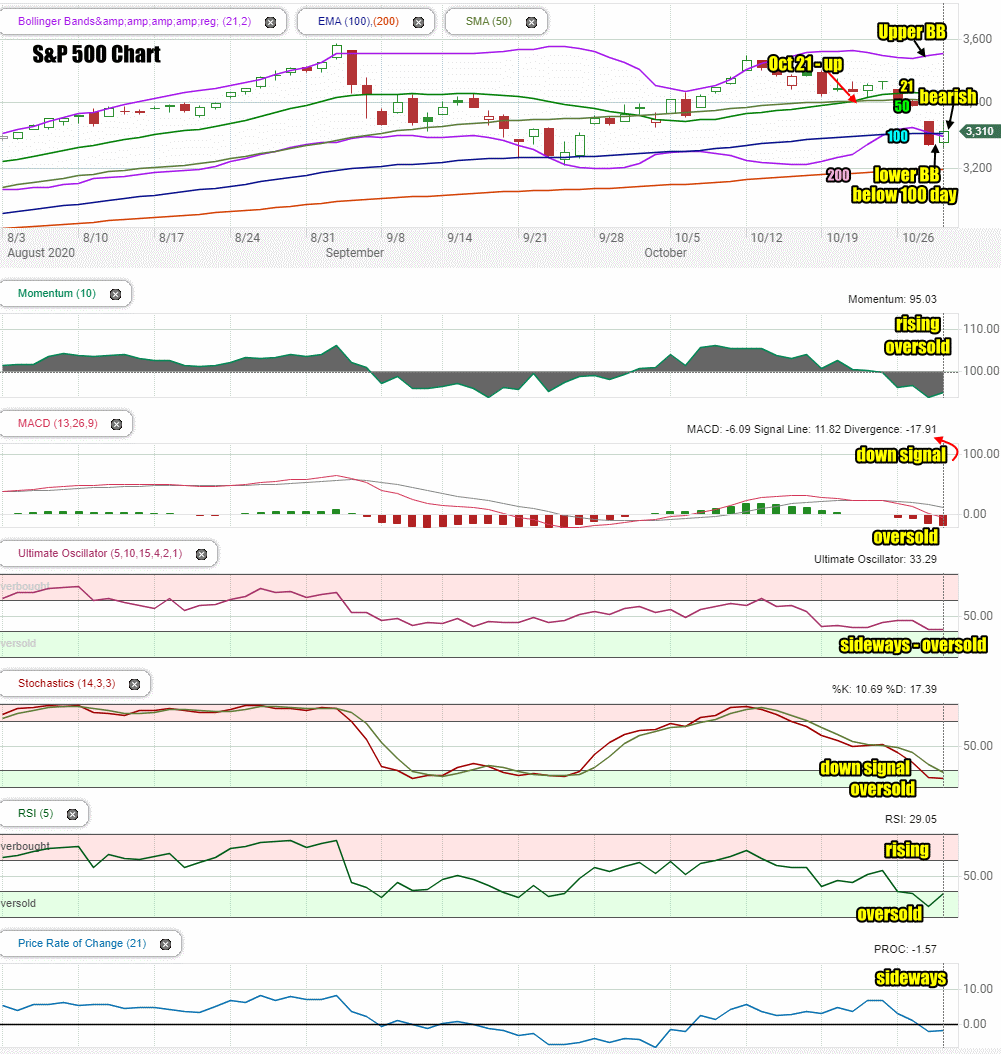
Thursday held out promise with all 3 indexes climbing but as the day wore on it became obvious sellers were using the rally to unload positions and take further profits.
The S&P closed up 39 points for a 1.1% gain to close at 3310. The NASDAQ rose 180 points recovering 42% of Wednesday’s decline but not enough to signal that the sell-off is ending.
Stock Market Outlook Chart Comments At The Close on Thu Oct 29 2020
Thursday’s chart shows the index closed above the Lower Bollinger Band and just above the 100 day moving average.
The rally during the day reached 3341 but lost 31 points of the rally in the final hour and a half. This left behind a green candlestick with long tails at either end which is usually a signal of indecision and bearishness.
As well the Upper Bollinger Band is still rising buy the Lower Bollinger Band is already starting to turn sideways. The 21 and 50 day moving average are falling while the 100 and 200 day moving averages are still climbing.
Friday looks set for the index to slide further and work its way to the 3250 level or possibly the 3200 level which last night I wrote, as being near or at the bottom of the sell-off in my opinion.

Stock Market Outlook review of Thu Oct 29 2020
Stock Market Outlook: Technical Indicators Review:
Momentum: Momentum is rising, negative and oversold.
- Settings: For momentum I use a 10 period when studying market direction.
MACD Histogram: MACD (Moving Averages Convergence / Divergence) issued a down signal on Oct 25. On Thursday the down signal was stronger. It is also showing oversold.
- Settings: For MACD Histogram, I am using the Fast Points set at 13, Slow Points at 26 and Smoothing at 9.
Ultimate Oscillator: The Ultimate Oscillator is turning sideways and oversold. It is not supporting a second bounce attempt.
- Settings: The Ultimate Oscillator settings are: Period 1 is 5, Period 2 is 10, Period 3 is 15, Factor 1 is 4, Factor 2 is 2 and Factor 3 is 1. These are not the default settings but are the settings I use with the S&P 500 chart set for 1 to 3 months.
Slow Stochastic: The Slow Stochastic has a down signal in place and is very oversold.
Settings: For the Slow Stochastic I use the K period of 14 and D period of 3. The Slow Stochastic tries to predict the market direction further out than just one day.
Relative Strength Index: The RSI signal is rising and signaling oversold.
- Settings: The relative strength index is set for a period of 5 which gives it 5 days of market movement to monitor. It is often the first indicator to show an overbought or oversold signal.
Rate of Change: The rate of change signal is turning sideways but not supporting a second bounce attempt.
- Settings: Rate Of Change is set for a 21 period. This indicator looks back 21 days and compares price action from the past to the present. With the Rate Of Change, prices are rising when signals are positive. Conversely, prices are falling when signals are negative. As an advance rises the Rate Of Change signal should also rise higher, otherwise the rally is suspect. A decline should see the Rate Of Change fall into negative signals. The more negative the signals the stronger the decline.
Support and Resistance Levels To Be Aware Of:
3600 is resistance
3500 is resistance
3450 is resistance
3400 is resistance
3375 is support
3300 is support
3275 is support
3200 is support
3150 is support
3050 is support
3000 is support
2975 is light support
2950 is light support
2900 is light support
Stock Market Outlook for Tomorrow – Fri Oct 30 2020
The chart is still showing oversold but the inability of all three indexes to hold onto most of the gains on Thursday is setting up the day on Friday for further losses.
We could see a further drop to start the day or early morning and then a bounce attempt again on Friday. Overall though, with the elections next week, Friday shows the technical indicators are still bearish enough to end the week lower.
Stock Market Outlook Archives
Stock Market Outlook for Wed Feb 5 2025 – Choppy With A Lower Close

Morning Investing Strategy Notes for Wed Feb 5 2025

Morning Investing Strategy Notes for Tue Feb 4 2025

Stock Market Outlook for Tue Feb 4 2025 – Possible Bounce But Lower Close

Morning Investing Strategy Notes for Mon Feb 3 2025

Stock Market Outlook for Mon Feb 3 2025 – Lower Close Over Tariff Worries

Morning Investing Strategy Notes for Fri Jan 31 2025

Stock Market Outlook for Fri Jan 31 2025 – Choppy – Dip Possible But Still Up

Morning Investing Strategy Notes for Thu Jan 30 2025

Stock Market Outlook for Thu Jan 30 2025 – Higher Open But Lower Close

Morning Investing Strategy Notes for Wed Jan 29 2025

Stock Market Outlook for Wed Jan 29 2025 – Bullish Even With The Fed

Morning Investing Strategy Notes for Tue Jan 28 2025

Stock Market Outlook for Tue Jan 28 2025 – Bounce Likely

Morning Investing Strategy Notes for Mon Jan 27 2025

Stock Market Outlook for Mon Jan 27 2025 – Overbought – Dips Likely – But Bullish Heading Into More Earnings

Morning Investing Strategy Notes for Fri Jan 24 2025

Stock Market Outlook for Fri Jan 24 2025 – Still Overbought – Choppy – Dips Likely – But Higher

Morning Investing Strategy Notes for Thu Jan 23 2025

Stock Market Outlook for Thu Jan 23 2025 – Overbought – Possible Flat to Lower Close

