Another day of selling on Thursday as comments by Fed Chair Powell did not sooth bond holders or stock investors regarding rising interest rates and the specter of rising inflation. While at present none of these “seems” to actually be an issue, investors are “looking down the road” and expect they will be. For that reason the selling has continued but in many ways often it looks more like a repositioning of capital from specific sectors and stocks, to those that will benefit most from an economy the may quickly expand as Covid-19 restrictions are lifted and employment and the economy rebound.
On Thursday the NASDAQ fell 274 points and the S&P 51 points and while it does look like “tech carnage” in many ways, it also looks more like “high flyers” carnage as many stocks that were overvalued during covid-19 are coming back into lower multiples. For that reason while selling is always a worry for investors, selling is also what creates opportunities at better prices for bigger profits.
Stock Market Outlook Chart Comments At The Close on Thu Mar 4 2021
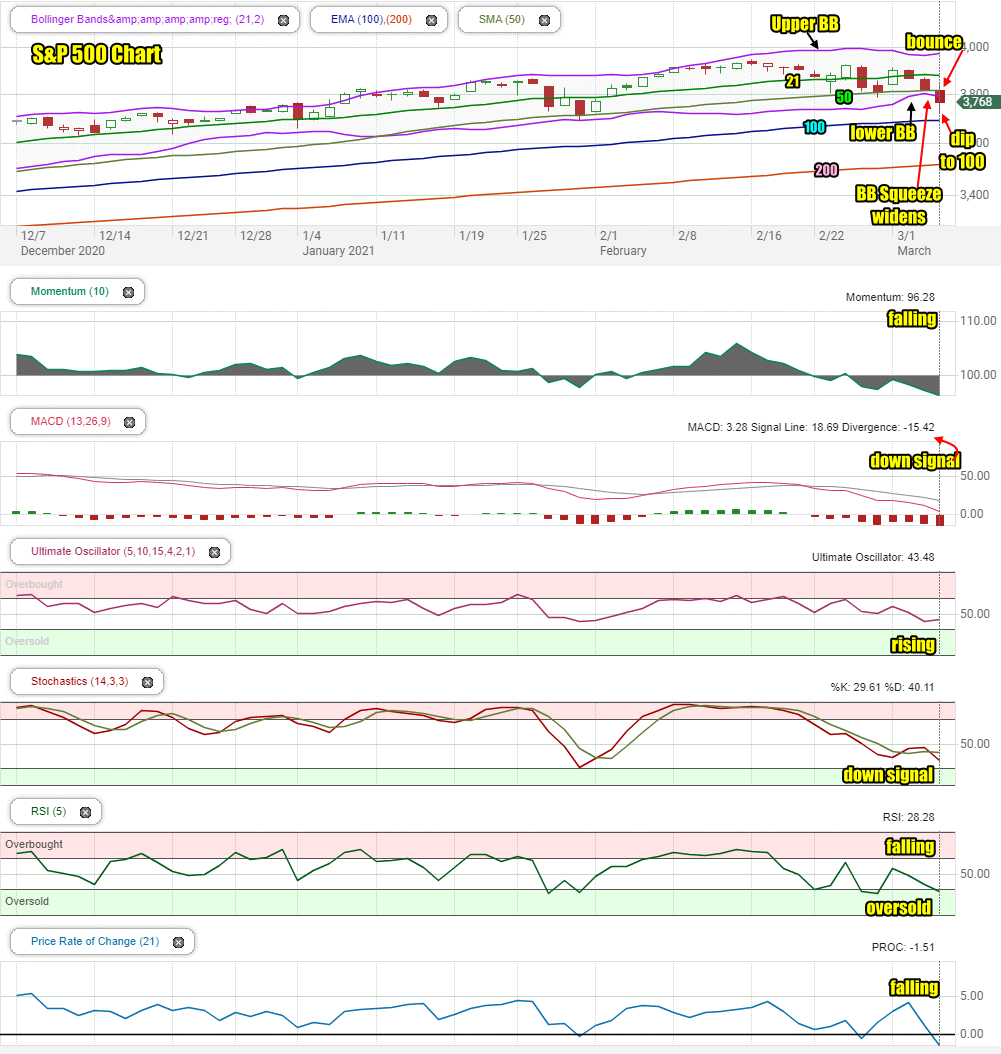
If you look at the SPX chart below you can notice that the Bollinger Bands Squeeze is starting to widen. It is just a small move but it could be signaling that selling could end shortly. At the same time, the drop today was the worse so far in this sell-off but as the index approached the 100 day moving average the market bounced back. I have marked this dip and rebound in the chart below.
The S&P was under selling pressure right from the open again on Thursday. The index closed below the 50 day and the 21 and 50 day are starting to dip. The closing candlestick is bearish but almost always this candlestick is a signal for a bounce. Often what we see is the market open, drops near the prior day’s low and then rebounds back up. If the rebound is stronger than expected, such as we saw on Monday, many investors who went short will cover which will drive the index higher than usual. That often leads to some selling on the next trading day, which in this case would be Monday.
The 100 and 200 day moving averages are all climbing higher.
While the chart does show the SPX is facing some trouble, the index still has not broken below the lows of Jan 29 and Feb 1. In other words, so far this is a normal correction in an ongoing bull market.

Stock Market Outlook review of Thu Mar 4 2021
Stock Market Outlook: Technical Indicators Review:
Momentum: Momentum is falling and negative. Readings are nearing bounce levels.
- Settings: For momentum I use a 10 period when studying market direction.
MACD Histogram: MACD (Moving Averages Convergence / Divergence) issued a down signal on Mon Feb 23 2021. On Thursday the down signal was much stronger again and the MACD histogram, the bar charts below the line indicators, is showing oversold. Again a bounce is probable.
- Settings: For MACD Histogram, I am using the Fast Points set at 13, Slow Points at 26 and Smoothing at 9.
Ultimate Oscillator: The Ultimate Oscillator is rising, not falling despite the big drop in the index today.
- Settings: The Ultimate Oscillator settings are: Period 1 is 5, Period 2 is 10, Period 3 is 15, Factor 1 is 4, Factor 2 is 2 and Factor 3 is 1. These are not the default settings but are the settings I use with the S&P 500 chart set for 1 to 3 months.
Slow Stochastic: The Slow Stochastic has a down signal in place. It is nearing oversold readings.
Settings: For the Slow Stochastic I use the K period of 14 and D period of 3. The Slow Stochastic tries to predict the market direction further out than just one day.
Relative Strength Index: The RSI signal is falling and into oversold readings which almost always are followed by a bounce.
- Settings: The relative strength index is set for a period of 5 which gives it 5 days of market movement to monitor. It is often the first indicator to show an overbought or oversold signal.
Rate of Change: The rate of change signal is falling which usually indicates investors shouldn’t expect a large move in prices. It too is reaching price levels where often we see a bounce in the index.
- Settings: Rate Of Change is set for a 21 period. This indicator looks back 21 days and compares price action from the past to the present. With the Rate Of Change, prices are rising when signals are positive. Conversely, prices are falling when signals are negative. As an advance rises the Rate Of Change signal should also rise higher, otherwise the rally is suspect. A decline should see the Rate Of Change fall into negative signals. The more negative the signals the stronger the decline.
Support and Resistance Levels To Be Aware Of:
4000 is resistance
3900 is resistance
3850 is support is light resistance.
3800 is support – was broken through finally today but is still not resistance.
3750 is support and held the market up today.
3700 is light support
3680 is light support – The 100 day moving average is at this valuation.
3600 is strong support
3550 is support
3500 is strong support
3450 is support. The 200 day moving average is just above this valuation. A drop this low would represent an 11% correction.
Stock Market Outlook for Tomorrow – Fri Mar 5 2021
From all the comments above and the technical indicators signals, many of which are showing oversold or near oversold, the SPX looks ripe for a bounce.
Often after a day like Thursday where the index fell almost to the 100 day, but climbed back from it to close, we will see the index slip again and then rebound.
For Friday, I am expecting a bounce of some strength in equities. The index may still close negative by the end of the day but a bottom is near or already in place. I will be buying shares of TQQQ in the morning on Friday, especially if the market dips or falls at the open.
We also get the unemployment report for February but unless it is extremely bearish on employment growth I don’t think for Friday it will impact the expected bounce. The biggest threat to any big bounce on Friday is a further jump in treasury yields.
Remember you always trade at your own risk. What I write about are my ideas only. I am not a financial planner or adviser and have no accreditations. I am a retail investor sharing my ideas and comments. Always do your own due diligence before risking capital.
Stock Market Outlook Archives
Morning Investing Strategy Notes for Thu Feb 6 2025

Stock Market Outlook for Thu Feb 6 2025 – Choppy Dips Possible But Still Up

Stock Market Outlook for Wed Feb 5 2025 – Choppy With A Lower Close

Morning Investing Strategy Notes for Wed Feb 5 2025

Morning Investing Strategy Notes for Tue Feb 4 2025

Stock Market Outlook for Tue Feb 4 2025 – Possible Bounce But Lower Close

Morning Investing Strategy Notes for Mon Feb 3 2025

Stock Market Outlook for Mon Feb 3 2025 – Lower Close Over Tariff Worries

Morning Investing Strategy Notes for Fri Jan 31 2025

Stock Market Outlook for Fri Jan 31 2025 – Choppy – Dip Possible But Still Up

Morning Investing Strategy Notes for Thu Jan 30 2025

Stock Market Outlook for Thu Jan 30 2025 – Higher Open But Lower Close

Morning Investing Strategy Notes for Wed Jan 29 2025

Stock Market Outlook for Wed Jan 29 2025 – Bullish Even With The Fed

Morning Investing Strategy Notes for Tue Jan 28 2025

Stock Market Outlook for Tue Jan 28 2025 – Bounce Likely

Morning Investing Strategy Notes for Mon Jan 27 2025

Stock Market Outlook for Mon Jan 27 2025 – Overbought – Dips Likely – But Bullish Heading Into More Earnings

Morning Investing Strategy Notes for Fri Jan 24 2025

Stock Market Outlook for Fri Jan 24 2025 – Still Overbought – Choppy – Dips Likely – But Higher

