 Prior Trading Day Summary:
On Wed Mar 19 2025 stocks spent much of the day lower as investors tried to build on Wednesday’s Fed induced rally. However volumes were too low and buyers were still on the sidelines. The SPX ended the day down just 12 points to 5662. There were 35 new 52 week highs and just 36 new lows. By the end of the day 61% of all volume was being traded lower.
The NASDAQ closed down 59 points at 17691. 50% of all volume was lower along with 62% of stocks. Volume was just 6.2 billion, the lowest quantity since Dec 24 when 4.7 billion shares traded hands.
Let’s review the SPX technical indicators at the close on Thu Mar 20 2025 to see if stocks might try to rally on Fri Mar 21 2025.
Stock Market Outlook: SPX Closing Chart For Thu Mar 20 2025
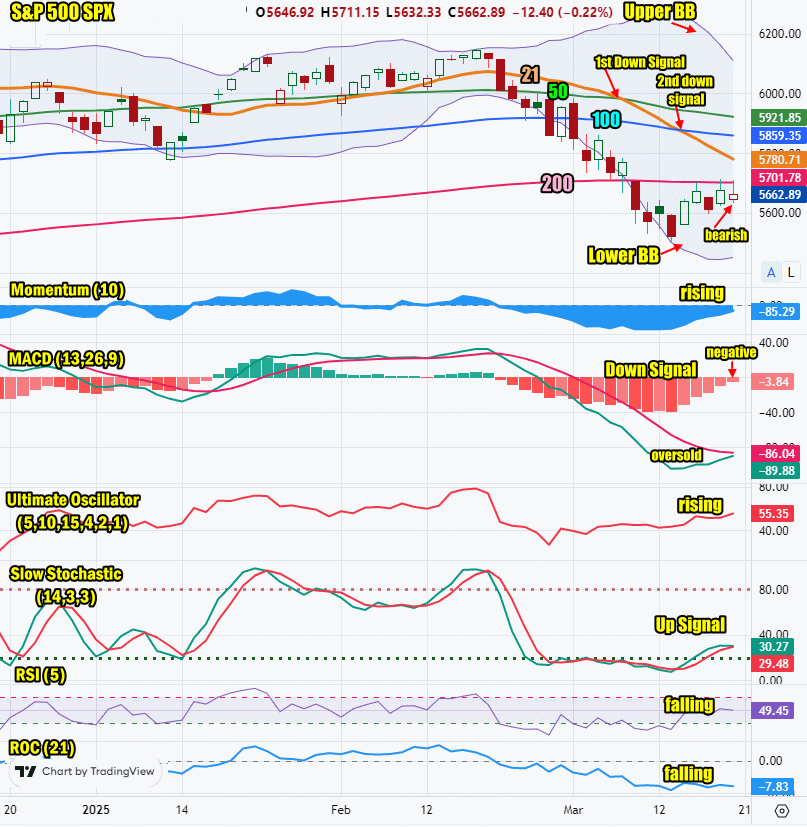
The index closed almost unchanged and managed to reach the 200 day but closed below it again. This is still bearish but a good sign for stocks.
The closing candlestick has a long shadow which suggests a bounce attempt is likely on Friday but will fail. This is bearish.
The 21 day moving average is falling and closed at 5780 which is bearish. The 21 day moving average fell below the 50 day on Friday Mar 7 and on Thursday Mar 13 it fell below the 100 day for a second down signal.
The 50 day moving average is falling and closed at 5921 which is bearish.
The 100 day moving average is falling and closed at 5859 which is bearish.
The 200 day moving average is falling and closed at 5701 which is bearish.
The Lower Bollinger Band is trying to turn up which will be bullish. The Upper Bollinger Band is turning sharply lower which may signal a chance the selling is ending. We may see a Bollinger Bands Squeeze next week and a move higher.
For Friday the SPX chart is still strongly bearish. A lower open is likely but a rally might be tried.

SPX Stock Market Outlook review of Thu Mar 20 2025
Stock Market Outlook: Technical Indicators Review
Momentum: Momentum is rising and negative.
|
MACD Histogram: MACD (Moving Averages Convergence / Divergence) issued a down signal on Mon Feb 21 2025. The down signal was almost gone on Thu Mar 20 2025.
|
Ultimate Oscillator: The Ultimate Oscillator is rising and positive.
|
Slow Stochastic: The Slow Stochastic has a weak up signal in place and is not oversold.
|
Relative Strength Index: The RSI signal is rising.
|
| Rate of Change: The rate of change signal is falling signaling a lower close is expected. Settings: Rate Of Change is set for a 21 period. This indicator looks back 21 days and compares price action from the past to the present. With the Rate Of Change, prices are rising when signals are positive. Conversely, prices are falling when signals are negative. As an advance rises, the Rate Of Change signal should also rise higher, otherwise the rally is suspect. A decline should see the Rate Of Change fall into negative signals. The more negative the signals the stronger the decline. |
Stock Market Outlook: Support and Resistance Levels |
| 6000 is resistance |
| 5970 is resistance |
| 5950 is resistance |
| 5900 is resistance |
| 5890 is resistance |
| 5875 is resistance |
| 5850 is resistance |
| 5800 is resistance |
| 5775 is resistance |
| 5750 is resistance |
| 5730 is resistance |
| 5700 is support |
| 5650 is support |
| 5630 is support |
| 5600 is support |
| 5585 is support |
| 5550 is support |
| 5500 is support |
| 5450 is support |
Stock Market Outlook for Fri Mar 21 2025
Technical indicators are showing a bit more strength to the upside as of Thursday’s close. In particular, the MACD indicator is almost ready to turn positive, which would be a major up signal. The Bollinger Bands are showing signs we might see a Bollinger Bands Squeeze next week and a move higher for the index. The closing candlestick though is signaling that Friday will end lower. This will not end the bullish outlook however, but earnings from Nike and FedEx (FDX) on Thursday after the close were poor and forward guidance points to further declines in profits for the next quarter. That will weigh on stocks today. Economic signals on Thursday pointed to a mixed outlook with better existing home sales but poor economic indicators and manufacturing survey results.
For Friday, I expect an attempt to open higher and then a dip lower. A rally might be tempted but the signals point to failure for any rally on Friday. We need to see volumes pick up which could help sustain a rally.
Potential Economic and Political Market Moving Events
Monday:
8:30 Retail sales rose 0.2% missing estimates of 0.6%
8:30 Retail sales minus autos rose to 0.3% meeting estimates
8:30 Empire state manufacturing surveyplunged to -20.9 missing estimates of -1.8
10:00 Business inventories came in as estimated at 0.3%
10:00 Home builder confidence index fell to 37 from 42 prior
Tuesday:
8:30 Housing starts were a lot higher than expected coming in at 1.50 million
8:30 Building permits didn’t fall as deeply as expected, coming in at 1.46 billion
8:30 Import price index surprised and rose to 0.4%
9:15 Industrial production also surprised, rising 0.7%
9:15 Capacity Utilization was higher than estimated, coming in at 78.2%
Wednesday:
2:00 FOMC interest rate decision
2:30 Fed Chair Powell news conference
Thursday:
8:30 Weekly Initial Unemployment Insurance Claims came in at 223,000 just 2,000 below estimates
8:30 Philadelphia Fed manufacturing survey dropped to 12.5
10:00 Existing home sales rose more than expected to 4.26 milli9on
10:00 Leading economic indicators fell more than estimated to -0.3%
Friday:
No reports

 Prior Trading Day Summary: